- Research article
- Open access
- Published:
Cadmium uptake and translocation in seedlings of near isogenic lines of durum wheat that differ in grain cadmium accumulation
BMC Plant Biology volume 4, Article number: 4 (2004)
Abstract
Background
Cadmium (Cd) concentrations in durum wheat (Triticum turgidum L. var durum) grain grown in North American prairie soils often exceed proposed international trade standards. To understand the physiological processes responsible for elevated Cd accumulation in shoots and grain, Cd uptake and translocation were studied in seedlings of a pair of near-isogenic durum wheat lines, high and low for Cd accumulation in grain.
Results
In short-term studies (<3 h) using 109Cd-labelled nutrient solutions, there were no differences between lines in time- or concentration-dependent 109Cd accumulation by roots. In contrast, rates of 109Cd translocation from roots to shoots following longer exposure (48–60 h) were 1.8-fold higher in the high Cd-accumulating line, despite equal whole-plant 109Cd accumulation in the lines. Over the same period, the 109Cd concentration in root-pressure xylem exudates was 1.7 to 1.9-fold higher in the high Cd-accumulating line. There were no differences between the lines in 65Zn accumulation or partitioning that could account for the difference between lines in 109Cd translocation.
Conclusion
These results suggest that restricted root-to-shoot Cd translocation may limit Cd accumulation in durum wheat grain by directly controlling Cd translocation from roots during grain filling, or by controlling the size of shoot Cd pools that can be remobilised to the grain.
Background
Cadmium (Cd) tends to accumulate in grain crops grown in North American prairie soils with naturally elevated Cd availability [1, 2]. Compared to bread wheat (Triticum aestivum L.), durum wheat (T. turgidum L. var durum) has a genetic propensity to accumulate Cd in grain [3] to levels often exceeding proposed international limits for Cd in cereal grains [4, 5]. Consequently, there is a need to develop low Cd-accumulating durum cultivars and agronomic management practices to minimise soil-to-plant transfer of Cd. While there has been progress in understanding how soil factors and agronomic management influence Cd accumulation in crops [1], the biological processes responsible for elevated Cd accumulation in durum grain remain poorly understood.
Durum wheat shows considerable genotypic variation in Cd accumulation in grain [4–6]. Cadmium accumulation in grain of high- and low-accumulating near-isogenic lines was correlated with Cd accumulation in the leaves of the seedlings under field conditions [2]. This suggests that differences in Cd accumulation in the vegetative phase may be important determinants of Cd accumulation in grain, or at least be indicative of Cd transport to grain during grain filling. Genotypic variation in Cd accumulation in shoots of seedlings may arise from differences in Cd uptake from soil, or from differences in Cd movement within the plant.
Root uptake and root-to-shoot translocation of Cd have been characterised in a variety of species, including wheat [1]. These processes have only recently been explored as possible explanations for high Cd-accumulation in durum wheat grain. Hart et al. [7] compared uptake and translocation of Cd in seedlings of bread and durum wheat cultivars. The bread wheat cultivar had higher rates of whole-plant and root uptake, and higher translocation to the shoots [7], suggesting these factors do not contribute to high Cd-accumulation in grain of durum wheat. In short-term experiments with seedlings of high and low Cd-accumulating durum wheat cultivars, Berkelaar and Hale [8] observed higher rates of Cd uptake by roots in the low Cd-accumulating cultivar. Archambault et al. [9] found no difference in short-term root Cd uptake by seedlings in a pair of high- and low-accumulating near-isogenic lines. After longer (>24 h) exposure, translocation of Cd to the shoots was 1.5 to 2-fold higher in the high Cd-accumulating isoline [9].
The contradictory results of these studies may partially reflect differences in experimental conditions, such as the absence of a desorption protocol to remove cell wall bound Cd in short-term uptake studies [8, 9], or the near-complete depletion of Cd from the uptake solution in long-term studies [9]. Discrepancies about the relative importance of root uptake and root-to-shoot translocation may also be attributable to the genotypes selected for experimentation. In the work of Hart et al. [7, 10], higher rates of root and whole-plant uptake, and higher translocation to the shoots for Cd in bread wheat were matched by similar patterns of zinc uptake and translocation. Recent studies of Cd and Zn root uptake in these cultivars [11] revealed a competitive interaction between Cd2+ and Zn2+, suggesting that Cd and Zn may share a common transport system at the root cell plasma membrane. Differences between durum and bread wheat cultivars in Cd uptake and translocation [7] may simply reflect differences in Zn uptake rather than intrinsic differences in Cd accumulation.
Recent field experiments with pairs of near-isogenic durum wheat lines, high and low for Cd accumulation in grain, showed that differences between isolines for Cd accumulation in grain were unrelated to accumulation of Zn or other cations [5]. The apparent independence of the mechanisms regulating Cd and Zn accumulation in these isolines provides an opportunity to re-examine the relationship between Cd accumulation in grain, and root uptake and root-to-shoot translocation of Cd. The objective of this study was to determine if root uptake and root-to-shoot translocation of 109Cd in seedlings of two near-isogenic durum wheat lines correlated with the propensity of the isolines to accumulate Cd in mature grain. We also studied uptake and translocation of 65Zn to determine if differences between isolines in 109Cd accumulation were specific to Cd.
Results
Short-term, time-dependent 109Cd accumulation in roots (after removing the desorbable fraction) was linear for at least 180 min (Figure 1A), and was not significantly different between the high and low Cd-accumulating isolines (F1,80 = 1.41, p = 0.238). Desorbable 109Cd accumulation in roots rapidly (10–15 min) saturated (Figure 1B) and was slightly higher in the low Cd-accumulating isoline (F1,80 = 47.9, p < 0.001). The desorbable component dominated total 109Cd accumulation in roots (desorbable + non-desorbable) for exposure times less than 120 min (Figure 1). After 180 min, desorbable 109Cd accumulation in roots accounted for 35 and 39% of total accumulation for TL-H and TL-L, respectively (Figure 1B inset). Cadmium accumulated in the root tips (1 cm) at a 2.1-fold higher rate than in the root bases for both isolines (Figure 2). There were no significant differences between isolines for 109Cd accumulation in root tips (F1,20 = 1.15, p = 0.295) or bases (F1,20 = 2.83, p = 0.108). After 180 min, 109Cd translocation from roots to shoots was negligible (<1% of non-desorbable accumulation) and not different between isolines (data not shown). Time-dependent 65Zn accumulation in desorbable and non-desorbable fractions of roots over 180 min was similar to that observed for 109Cd (data not shown). There was no significant difference between isolines in short-term time-dependent 65Zn accumulation in desorbed roots (F1,80 = 0.82, p = 0.368).

Short-term 109Cd accumulation in roots of durum wheat seedlings. Time-course of 109Cd accumulation in intact roots (A) of high (TL-H) and low (TL-L) Cd-accumulating isolines of durum wheat. Roots of 6-d old seedlings were exposed for up to 180 min in 15 mL of complete nutrient solution containing 50 pM 109Cd and 0.5 μM 65Zn. Desorbable 109Cd (B) was removed following treatment by a 30 min (2°C) wash in non-radiolabelled nutrient solution containing 50 μM DTPA. Inset shows desorbable 109Cd expressed as a percentage of total 109Cd accumulation in the roots. Means and standard errors of 5 replicates (3 plants per replicate) are plotted.

Spatial variation in 109Cd accumulation in roots of durum wheat seedlings. Time-course of 109Cd accumulation in root tips (1 cm) and basal root sections of high (TL-H) and low (TL-L) Cd-accumulating isolines of durum wheat. Intact roots of 6-d old seedlings were exposed for up to 180 min in 15 mL of complete nutrient solution containing 50 pM 109Cd. Roots were desorbed for 30 min (2°C) prior to harvest in non-radiolabelled nutrient solution containing 50 μM DTPA. The 3 longest roots per plant were separated into root tips and remaining basal portions. Means and standard errors of 3 replicates (5 plants per replicate) are plotted.
Concentration-dependent uptake kinetics for Cd2+ over an activity range of 4 to 1288 nM (5–1800 nM total Cd) were characterised by smooth, nonsaturating curves for both isolines (Figure 3A). These curves could be graphically dissected into saturable and linear components. Kinetic constants for the saturable and linear components were derived by fitting the sum of a hyperbolic (Michaelis-Menten kinetics) and linear function to the raw data using the following equation:
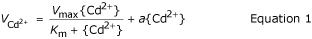
where {Cd2+} is the Cd2+ activity, VCd2+ is the Cd2+ uptake rate, and Vmax, Km, and a the kinetic parameters. R2 values for the fitted curves were 0.977 and 0.982 for TL-H and TL-L, respectively (Table 1). A hyperbolic function alone described the kinetics of Cd2+-influx as equally well as Equation 1 for both isolines (similar R2 values), but systematic variation of plotted residuals for the hyperbolic functions established the fit of this model to the data to be incorrect (data not shown). Although influx of Cd2+ in TL-H was slightly higher than in TL-L at most Cd2+ activities greater than 100 nM (t ≥ 2.05, p < 0.05), the kinetic parameters for the saturable (Km, Vmax) and linear (a) components were statistically similar in the two isolines (Table 1). In separate experiments, Cd2+ influx over a lower concentration range (0.05–100 nM) was linear and not different between isolines (data not shown). As differences between the high and low Cd-accumulating isolines for Cd2+ influx characteristics were negligible, no further experiments were undertaken to characterise the saturable and linear components. A number of earlier studies have provided strong circumstantial evidence for the linear component to consist of non-desorbable cell wall binding [7, 10, 12].

Concentration-dependent Cd accumulation in roots of durum wheat seedlings. Concentration-dependent Cd accumulation in roots (A) of high and low Cd-accumulating isolines of durum wheat. Intact roots of 6-d old seedlings were exposed for 30 min to 15 mL of complete nutrient solution containing 5–1800 nM Cd labelled with 109Cd. Desorbable Cd (B) was removed following treatment by a 30 min (2°C) wash in non-radiolabelled nutrient solution containing 50 μM DTPA. Inset shows desorbable Cd expressed as a percentage of total Cd accumulation in the roots. Means and standard errors of 5 replicates (3 plants per replicate) are plotted.
Concentration-dependent accumulation of desorbable Cd2+ by roots increased linearly with increasing Cd2+ activity (Figure 3B) and was significantly higher in the low Cd-accumulating isoline (F1,80 = 81.1, p < 0.001). Consistent with the short-term uptake experiments, desorbable Cd2+ dominated accumulation by roots following a 30 min exposure to a broad range of physiologically relevant Cd2+ activities (Figure 3B inset), and was slightly higher (7%) in TL-L than in TL-H (F1,80 = 124, p < 0.001). There was significant variation among Cd2+ activities for the proportion of desorbable Cd2+ accumulation in the roots (F9,80 = 4.44, p < 0.001), although this was entirely due to a low value at one Cd2+ activity (286 nM). There was no significant variation in the proportion of desorbable Cd2+ among the remaining Cd2+ activities.
Desorption of the roots with 50 μM DTPA in complete nutrient solution was rapid and independent of the Cd concentration in the uptake solution (Figure 4). After a 30-min uptake period in different concentrations of 109Cd (50 pM and 0.5 μM), most of the 109Cd desorbed was removed during the first 2-min. After 10 to 15 min desorption there was little additional 109Cd released from the roots. The proportion of 109Cd desorbed after 60 min was the same for both Cd concentrations (80%, Figure 4 inset). Similar desorption profiles were measured in the high (TL-H) Cd-accumulating isoline (data not shown).

Time-course of Cd desorption from roots of durum wheat seedlings. Time-course of Cd desorption from intact roots of a low (TL-L) Cd-accumulating isoline of durum wheat. Roots of 6-d old seedlings were exposed for 30 min to 15 mL of complete nutrient solution containing 50 pM 109Cd or 0.5 μM Cd (labelled with 109Cd). Roots were desorbed in non-radiolabelled nutrient solution containing 50 μM DTPA for up to 60 min (2°C) prior to harvest. Inset shows Cd remaining in the roots as a percentage of Cd accumulation prior to desorption (0 min). Means and standard errors of 5 replicates (3 plants per replicate) are plotted.
Long-term exposure of seedlings to 109Cd showed that there were differences in Cd partitioning between the two isolines. Time-dependent 109Cd accumulation in desorbed roots was linear up to 60 h (Figure 5A), and TL-L accumulated significantly more 109Cd than TL-H following 24–60 h of continuous exposure (t ≥ 2.09, p < 0.05). The amount of 109Cd desorbed from the roots after 3–12 h (around 0.2 pmol g fresh weight-1, Figure 5B) was similar to the amount desorbed during the short-term studies (Figure 1B). For uptake periods longer than 12 h the amount of 109Cd desorbed from roots declined by approximately 50%, and there were no significant differences between isolines for the amounts or proportions of 109Cd desorbed from the roots (t ≤ 1.82, p > 0.05). Following a 60-h uptake period, desorbable 109Cd accumulation account for less than 1.5% of total 109Cd accumulation in the roots of both isolines (Figure 5B inset). Greater 109Cd accumulation in the roots of TL-L is a result of slower translocation of 109Cd to the shoots in this isoline (Figure 6A) rather than greater uptake by the roots. There was no significant difference between isolines in whole-plant 109Cd accumulation over this period (F1,84 = 0.28, p = 0.601; Figure 6B). The 109Cd concentration in the shoots of TL-H was significantly higher than in the shoots of TL-L for exposure periods greater than 12 h (t ≥ 2.09, p < 0.05). Following a 60-h uptake period, root-to-shoot 109Cd translocation was 1.8-fold higher in TL-H than in TL-L (Table 2).

Long-term 109Cd accumulation in roots of durum wheat seedlings. Time-course of 109Cd accumulation in intact roots (A) of high (TL-H) and low (TL-L) Cd-accumulating isolines of durum wheat. Roots of 6-d old seedlings were exposed for up to 60 h (solutions changed every 12 h) in 15 mL of complete nutrient solution containing 50 pM 109Cd and 0.5 μM 65Zn. Desorbable 109Cd (B) was removed following treatment by a 30 min (2°C) wash in non-radiolabelled nutrient solution containing 50 μM DTPA. Inset shows desorbable 109Cd expressed as a percentage of total 109Cd accumulation in the roots. Means and standard errors of 7 replicates (3 plants per replicate) are plotted.

Long-term shoot and whole-plant 109Cd accumulation in durum wheat seedlings. Time-course of 109Cd translocation to shoots (A) and Cd accumulation per plant (B) of high (TL-H) and low (TL-L) Cd-accumulating isolines of durum wheat. Roots of 6-d old seedlings were exposed for up to 60 h (solutions changed every 12 h) in complete nutrient solution containing 50 pM 109Cd and 0.5 μM 65Zn, followed by a 30 min (2°C) desorption in non-radiolabelled nutrient solution containing 50 μM DTPA. Means and standard errors of 7 replicates (3 plants per replicate) are plotted.
In contrast to 109Cd, there were no significant differences in 65Zn partitioning between the two isolines (F1,84 < 0.01, p = 0.947; Table 2). Similarly, there were no significant differences between isolines for 65Zn accumulation in shoots (F1,84 = 1.81, p = 0.182; Figure 7B) or whole plants (F1,84 = 2.94, p = 0.090; Figure 7C). Long-term 65Zn accumulation in roots (Figure 7A) was slightly higher in TL-L than in TL-H (F1,84 = 7.64, p = 0.007).

Long-term 65Zn accumulation in durum wheat seedlings. Time-course of 65Zn accumulation in intact roots (A), 65Zn translocation to shoots (B), and 65Zn accumulation per plant (C) of high (TL-H) and low (TL-L) Cd-accumulating isolines of durum wheat. Roots of 6-d old seedlings were exposed for up to 60 h (solutions changed every 12 h) in 15 mL of complete nutrient solution containing 50 pM 109Cd and 0.5 μM 65Zn. Desorbable 65Zn was removed following treatment by a 30 min (2°C) wash in non-radiolabelled nutrient solution containing 50 μM DTPA. Inset shows desorbable 65Zn expressed as a percentage of total 65Zn accumulation in the roots. Means and standard errors of 7 replicates (3 plants per replicate) are plotted.
The time-course of 109Cd concentration in xylem sap root-pressure exudates (Figure 8A) was similar to that of 109Cd accumulation in shoots. The 109Cd concentration in xylem sap increased linearly for up to 60 h, and was significantly higher in TL-H than in TL-L for uptake periods longer than 12 h (t ≥ 2.07, p < 0.05). Following a 60-h uptake period, the 109Cd concentration in xylem sap was 1.9-fold higher in the high Cd-accumulating isoline. The 109Cd concentration in xylem sap was correlated with 109Cd accumulation in the shoots of both isolines (r = 0.863 and 0.705 for TL-H and TL-L, respectively). The rate of sap exudation was consistently higher in TL-H (F1,90 = 33.3, p < 0.001; Figure 8B).

109Cd transport in xylem sap of durum wheat seedlings. Time-course of 109Cd concentration in xylem sap (A) and the rate of xylem sap exudation (B) of high (TL-H) and low (TL-L) Cd-accumulating isolines of durum wheat. Roots of 6-d old seedlings were exposed for between 12 and 60 h in 15 mL of complete nutrient solution containing 25 pM 109Cd (solutions changed every 12 h). Shoots were then excised 5–7 mm above the roots and xylem sap collected for 6 h. Means and standard errors of 10 replicates are plotted.
Discussion
This study provides evidence for a link between translocation of Cd from roots to shoots in seedlings and Cd accumulation in mature grain of durum wheat. The high grain-Cd isoline (TL-H) averaged 1.8-fold higher Cd translocation (shoot 109Cd/root 109Cd ratio, Table 2) than the low grain-Cd isoline (TL-L) after 48–60 h of continuous exposure to non-toxic Cd concentrations. Over the same period, the 109Cd concentration in root-pressure xylem exudates was 1.7 to 1.9-fold higher in the high Cd-accumulating isoline (Figure 8A). In earlier research with the same near-isogenic lines 109Cd accumulation in shoots and the shoot/root 109Cd accumulation ratio proved effective at identifying the high- and low-accumulating lines in seedlings [9]. However, this research did not clearly establish if genotypic variation in Cd uptake by roots contributed to isoline differences in shoot Cd accumulation. In short-term uptake experiments (<8 h) there were no differences in root 109Cd uptake, but following longer exposure (>24 h) 109Cd accumulation in roots and shoots was higher in the high grain-Cd isoline [9]. The results of our current study show that genotypic variation in root-to-shoot Cd translocation alone accounts for the difference between isolines in shoot Cd accumulation. There were no differences between isolines in Cd uptake by roots (Figure 1, 2, 3) or whole-plants (Figure 6B) that could account for the difference in root-to-shoot Cd translocation.
Retention of Cd in the roots as a factor contributing low Cd accumulation in shoots and grain has been observed in variety of crop species. In a potted soil experiment, differences in shoot Cd accumulation by seedlings of four durum wheat cultivars were related to differential root-to-shoot translocation [13]. After 2 weeks growth in a high-Cd agricultural soil the four cultivars had similar total Cd accumulation per plant but the two high grain-Cd cultivars had higher shoot Cd concentrations, higher root-to-shoot Cd translocation, and lower root Cd concentrations [13]. Differences among soybean (Glycine max) varieties for Cd accumulation in seeds were also related to root-to-shoot translocation in the vegetative period. In 3-4-week old soybean plants, Cd translocation to the shoots, as a proportion of whole-plant Cd accumulation, was 2.6-3.2-fold higher in the high Cd-accumulating varieties [14]. In a pair of potato (Solanum tuberosum) cultivars, differences in tuber Cd concentration could be accounted for by a 3-fold higher retention of Cd in the roots of the low Cd-accumulating cultivar [15]. Genotypic variation in maize (Zea mays) for Cd accumulation in the shoots of 19 inbred lines grown in Cd-contaminated soil and solution culture was related to differences in internal distribution [16]. Shoot Cd accumulation in the high-Cd maize lines was about 7-fold higher than in the low-Cd lines despite nearly equal whole-plant Cd accumulation for the two groups [16]. In contrast to these results, Hart et al. [7] found that a bread wheat cultivar (low grain-Cd) had higher rates of whole-plant and root Cd uptake, and higher Cd translocation to the shoots than a durum wheat cultivar (high grain-Cd). The contradiction between our results and those of Hart et al. [7] may relate to genotypic differences in Zn uptake and translocation.
There were no differences between isolines in short- or long-term Zn accumulation. Over an uptake period of 60 h, when differences between the isolines in Cd translocation became apparent, shoot and root Zn concentrations, whole-plant Zn accumulation, and Zn partitioning were nearly equal in the two isolines (Figure 7, Table 2). This result contrasts with the work of Hart et al. [7, 10]. In a series of experiments using durum and bread wheat cultivars, uptake and translocation of both Cd and Zn were higher in the bread wheat cultivar than in the durum wheat cultivar [7, 10]. More recent research with these cultivars showed that Cd2+ and Zn2+ competitively inhibited root uptake in a reciprocal manner [11], suggesting Cd and Zn compete for common transporter at the plasma membrane. Other studies have also demonstrated the inhibitory effect of Zn on Cd uptake by roots [17–19]. Heavy metal ions, such as Cd2+, are most likely transported across plant membranes via transporters for other divalent cations (such as Zn2+, Cu2+, Fe2+, or Ca2+) that show poor selectivity [20]. Recent molecular studies demonstrate that many cation transporters show a broad substrate range, enabling uptake of non-essential metals such as Cd. For example, a heavy metal transporter cDNA, ZNT1, cloned from the hyperaccumulator Thlaspi caerulescens, was shown to mediate uptake of both Zn2+ and Cd2+ when expressed in yeast (Saccharomyces cerevisiae) [21]. It seems likely that differences between the durum and bread wheat cultivars in Cd uptake and translocation [7] may simply reflect similar differences in Zn uptake and translocation between these cultivars [10] rather than intrinsic differences in Cd accumulation. The independence of Cd and Zn translocation in this study provides additional evidence for the specificity of the low-Cd trait in these isolines. Field experiments have shown that differences between the isolines for Cd accumulation in grain were unrelated to accumulation of other cations [5].
Distinguishing uptake into the symplast from apoplastic binding is a major problem in studies of root uptake of divalent cations. Binding of divalent cations in the apoplasm may represent a substantial fraction of metal accumulation by roots, especially following short exposure times [22]. In studies where protocols to remove Cd bound in the apolasm were absent or inadequate, short-term (<3 h) time-dependent accumulation of Cd by roots was characterised by a rapid curvilinear phase of accumulation followed by a slower linear phase of accumulation [17, 23–25]. Desorbing roots with a large excess of a competing cation or chelating agent following exposure has been successful in eliminating the curvilinear phase of Cd or Zn accumulation [7, 12, 25]. These results are consistent with short-term Cd accumulation in roots consisting of a rapidly saturating, desorbable component and a linear, non-desorbable component, a pattern that is clearly shown in short-term Cd accumulation by durum wheat roots (Figure 1). The rapidly saturating desorbable component (Figure 1B) is probably exchangeable binding to anionic charges of cell wall constituents [22]. Saturation of the desorbable component reflects the equilibrium between Cd2+ and other cations for binding to cell wall sites, rather than absolute saturation of binding sites with Cd2+. Clearly, the roots have much more capacity for desorbable Cd binding (Figure 3B, 4). Although the linear, time-dependent Cd accumulation of desorbed roots intersected the y-axis close to the origin (Figure 1A), suggesting near complete removal of Cd from the apoplasm, the possibility of a non-desorbable cell wall bound fraction can not be discounted as shown in other studies with Cd and Zn [7, 10, 12, 18, 19, 26].
In this study, the roots were desorbed for 30 min at 2°C with a complete nutrient solution that included 50 μM DTPA to chelate Cd. The amount and relative proportion of Cd desorbed from the roots using this protocol was dependent on both exposure time and Cd concentration. After rapid initial saturation, the amount of Cd desorbed from the roots was constant for up to 12 h (Figure 1B, 5B). The decline in Cd desorbed from the roots following longer exposure periods (>12 h, Figure 5B) may be attributable to 2-fold greater depletion of Cd from the uptake solutions during this period since the size of the desorbable pool was directly dependent on the external Cd concentration to which the roots were exposed (Figure 3B). As a percentage of total Cd accumulation by the roots, the desorbable Cd pool dominated uptake over short exposure periods (<120 min) but rapidly declined with increasing exposure time (Figure 1B inset, 5B inset). In contrast, the proportion of total Cd accumulation by roots that was desorbable was independent of the external Cd concentration. Following a 30 min exposure to a wide range of Cd concentrations (50 pM to 1.8 μM), the desorbable fraction was constantly high, at between 72–82% and 75–87% for TL-H and TL-L, respectively (Figure 1B inset, 3B inset, 4 inset). This result is in marked contrast to several studies with Cd and Zn [7, 10, 18], where the proportion of desorbable Cd or Zn increased with increasing concentration in the uptake solution.
The slightly higher amount of Cd desorbed from the roots of TL-L in the short-term experiments (Figure 1B, 3B) is unlikely to account for reduced translocation of Cd to the shoots in this isoline. Differences between the isolines in Cd translocation were not recorded until after 24 h of continuous exposure to Cd (Figure 6A, 8A, Table 2). At this time, desorbable Cd accumulation in roots was less than 4% of total Cd accumulation and was not different between the high and low Cd-accumulating isolines (Figure 5B inset).
Time-dependent accumulation of 109Cd by roots was linear in both short-term (Figure 1A, 2) and long-term (Figure 5A) experiments. Furthermore, the rates of Cd accumulation were similar in short-term (0.11 pmol g fresh weight-1 h-1 for both isolines) and long-term (0.08 and 0.10 pmol g fresh weight-1 h-1 for TL-H and TL-L, respectively) experiments, suggesting that even after long exposure times (up to 60 h) there was limited efflux of Cd or suppression of Cd influx. This constancy of time-dependent Cd accumulation is probably related to the low external Cd concentrations (50 pM) use in these experiments. Even after 60 h, 109Cd accumulation in the roots at 50 pM Cd was less than 0.5% of 109Cd accumulation in the roots exposed to 1.8 μM Cd for 0.5 h (Figure 3A). Linear time-dependent accumulation of Cd in roots has been reported previously in both short-term [7, 18, 23] and long-term [7, 19] experiments using higher, but non-toxic Cd concentrations (≤ 0.5 μM). There were no differences between the isolines for short-term 109Cd uptake by whole root systems (Figure 1) or root apices (Figure 2). The higher rate of 109Cd influx at root apices is consistent with direct measurements of Cd2+ fluxes along roots of bread wheat [27].
The concentration-dependent kinetics of Cd2+ influx were characterised by smooth, nonsaturating curves for both isolines (Figure 3A). The absence of concentration-dependent saturation has also been observed in other studies with Cd [7, 11, 26] and Zn [10, 12]. These datasets have been resolved into saturable and linear kinetic components. By eliminating the saturable component using a combination of low temperature to inhibit metabolic activity and lipid-free cell wall preparations, the linear kinetic component has been interpreted as representing non-desorbable binding of Cd in the apoplasm, whereas the remaining saturable component is the result of carrier-mediated transport across the plasma membrane [7, 10, 12]. The Cd2+ influx curves for both isolines also showed a saturable component and a linear component (Table 1). The kinetic constants for the saturable and linear components were similar in the two isolines. The absence of clear differences in Km and Vmax values for Cd2+ uptake between the isolines implies that the greater accumulation of Cd in shoots of the high grain-Cd isoline is not a direct consequence of differential Cd-influx rates in roots. Furthermore, slightly greater Cd2+ influx in TL-H at Cd2+ activities greater than 100 nM cannot account for the observed patterns of shoot Cd accumulation. Clear differences in Cd translocation were recorded at much lower Cd concentrations (50 pM) where isoline differences in Cd uptake were absent. No differences in concentration-dependent Cd2+ influx were also reported for cultivars of durum and bread wheat [7, 11].
Although the pattern of Cd2+ influx (saturable and linear components) in this study is similar to other published data, the kinetic constants for the saturable component are dissimilar from those reported in other studies. The Km values of 166 to 227 nM for Cd2+ uptake measured in this study are higher than those measured in bread and durum wheat (20–67 nM [7, 11]), soybean (76–88 nM [18]), and Lupinus albus (42 nM [19]). The Vmax values measured in this study (0.67–0.87 nmol g-1 h-1) are substantially lower than those reported in other studies. For example, Vmax values measured in bread and durum wheat (26–38 nmol g-1 h-1 [7, 11]) are 30 to 55-fold higher than those measured in this study. The lower affinity (higher Km) and Vmax for Cd2+ influx reported here probably reflects the background composition of the uptake solution (complete nutrient solution). In the examples cited above, low ionic strength background solutions (0.2–0.5 mM CaCl2 or CaSO4) were used. Increasing the concentration of other divalent cations would be expected to inhibit Cd2+ influx due to reduced plasma membrane electronegativity [28], non-competitive inhibition of influx by a variety of cations [19, 24], or direct competition for specific cation transporters such as observed between Cd2+ and Zn2+ [11, 18]. For example, adding 10 μM ZnSO4 to the uptake solution (0.2 mM CaSO4) increased Km values for Cd2+ influx from 59–67 nM (0.2 mM CaSO4 alone) to 190–404 nM in bread and durum wheat [11].
Cadmium accumulation in shoots is driven mainly by mass flow due to transpiration. Treatments that reduce transpiration, such as application of absiscic acid to induce stomatal closure [29] or increasing relative humidity around the shoots [23], greatly reduce translocation of Cd to the shoots. However, the differences between the high and low Cd-accumulating isolines in shoot Cd accumulation appear unrelated to transpiration. In the absence of transpirational flow, the timing and magnitude of isoline differences in Cd concentration of root-pressure xylem exudates (Figure 8A) closely followed the pattern of root-to-shoot Cd translocation in intact plants (Figure 6A). In maize, Cd concentrations in root-pressure xylem exudates from high Cd-accumulating lines were higher than those from low Cd-accumulating lines [30], and there was no relationship between shoot Cd concentration and transpiration rate [16].
Even though xylem sap was collected in the absence of transpirational flow, there was a consistent difference between the isolines in the rate of xylem sap exudation (Figure 8B). The factors responsible for greater xylem sap exudation in the high Cd-accumulating isoline are not known, but may include isoline specific differences in root architecture, root hydraulic conductance, or xylem loading of major solutes [22]. Maintenance of stable xylem sap exudation rates over the course of our experiments suggests there was no decline in the metabolic activity of roots in this experimental system.
The physiological mechanism that restricts Cd translocation to the shoots in the low grain-Cd isoline has not been identified. Subsequent to Cd uptake into the root symplasm, processes that could influence the Cd translocation to the shoot include sequestration of Cd inside root cells, symplastic transport into the stele, loading into the xylem, and complexation of Cd in xylem sap. Studies of inheritance of the low Cd-accumulation trait in durum wheat, suggests that grain Cd concentration is largely controlled by a single gene [6]. Recent research with mature plants showed that the TL isoline pair differed in Cd transport from flag leaf to grain via the phloem [31]. It is unlikely that a single-gene trait could account for genotypic differences in loading or transport of Cd in both xylem and phloem, given the markedly different biology of these pathways [22]. Rather, restricted translocation of Cd to the shoots in the low grain-Cd isoline may be attributable to greater sequestration of Cd in the root symplasm. Sequestration of Cd into chemical complexes or physical compartments, such as the vacuole, could occur in root and shoot tissues thereby reducing its availability for loading into xylem and phloem.
Conclusions
This study has clearly established that differences between a pair of near-isogenic durum lines for Cd accumulation in shoots are solely due to differences in root-to-shoot Cd translocation. No differences between isolines in Cd uptake by roots or whole-plants were observed. Furthermore, Cd translocation to the shoots of seedlings correlates with capacity of these and other durum wheat isolines to accumulate Cd in grain under field conditions [2, 6, 9]. This suggests restricted root-to-shoot Cd translocation may limit Cd accumulation in grain by directly controlling Cd translocation from roots during grain filling, or by controlling the size of shoot Cd pools that can be remobilised to the grain [31].
Methods
Plant growth
A pair of near-isogenic durum wheat (Triticum turgidum L. var durum) lines, high (8982-TL-H) and low (8982-TL-L) for grain Cd accumulation [32], were used in these experiments. Field studies have shown that the high line accumulates 2.5-fold higher concentrations of Cd in mature grain than the low line [2, 5]. Seeds of each isoline were surface sterilised in 1.2 % NaOCl for 20 min, rinsed, and imbibed for 24 h in a solution of 0.005 g L-1 Vitavax (Uniroyal Chemical Ltd, Calgary, AB, Canada) to limit fungal growth. The germinated seeds were placed on nylon mesh suspended over 10 L of aerated nutrient solution (pH 6.0), containing 1.0 mM Ca(NO3)2, 0.4 mM KNO3, 0.3 mM NH4NO3, 0.3 mM Mg(NO3)2, 0.1 mM K2HPO4, 0.1 mM K2SO4, 10 μM Fe(III)-ethylenediamine di(o-hyroxyphenylacetic acid) (Sigma E-1273), 2.0 μM MnCl2, 6.0 μM H3BO3, 0.5 μM ZnSO4, 0.15 μM CuSO4, and 0.1 μM Na2MoO4. All solutions were prepared in double deionized water (>18 M Ω purity). Seedlings were grown for 2 d in the dark and for a further 4 d in a growth chamber with a photon flux density of 350 μmol m-2 s-1 and day/night temperatures of 21/16°C (16/8 h). Twelve hours prior to treatment the caryopses were removed, and the seedlings were transferred to fresh nutrient solution under the experimental conditions of continuous light (75 μmol m-2 s-1 photon flux density) and constant temperature (20°C). All experiments used the same complete nutrient solution as used for plant culture (see above) with the addition of radiolabelled CdCl2. Cadmium concentrations less than 100 pM were prepared by adding carrier-free 109CdCl2 (167–318 Bq mL-1). Higher Cd concentrations were prepared from a combination of CdCl2 and 109CdCl2 (100–125 pM 109Cd, 337–634 Bq mL-1). Some time-course experiments we dual-labelled with 109Cd and 65Zn by replacing ZnSO4 with 65ZnCl2 (0.5 μM 65Zn, 407–409 Bq mL-1). Calculation of chemical speciation using GEOCHEM-PC [33] predicted 97% of total Cd occurred in solution as a free metal (Cd2+) for all experimental Cd concentrations (25 pM–1.8 μM). Low Cd concentrations in the uptake solutions were chosen to minimise Cd binding to root cell wall constituents and to simulate soil solution Cd2+ concentrations that might be experienced in non-polluted agricultural soils.
Uptake experiments
Roots of intact, 6-d old seedlings of isolines TL-L and TL-H were rinsed twice in deionized water, and then transferred to plastic uptake tubes (3–5 seedlings per tube) containing 15 mL of radiolabelled nutrient solution (pH 6). Roots were exposed for 5–180 min (short-term), or 3–60 h (long-term). Uptake solutions were replaced every 12 h in the long-term experiments. At the end of the absorption period, roots were rinsed twice in deionized water and desorbed for 30 min in 15 mL of ice-cold (2°C) radioisotope-free complete nutrient solution containing 50 μM DTPA (diethylenetriamine pentaacetic acid) to chelate desorbed cations. Uptake tubes were gently shaken, but not aerated, during uptake and desorption. Following desorption, roots were blotted, excised, weighed, and dried. Spatial variation in Cd uptake in roots was determined by harvesting the 3 longest roots per plant and separating them into root tips (1 cm) and the remaining basal sections.
109Cd in xylem sap
Seedlings were cultured as described above. At 2 d following germination (when the coleoptile was 15 to 20 mm long) a perforated 0.6 mL microcentrifuge tube cap was placed over the coleoptile (top of cap facing downwards). After a further 4 d growth the cap had formed a firm, but not restrictive, supporting collar around the base of the shoot. An excess of collared plants were prepared to ensure only uniform and heathly plants were selected for experimentation. The collars were attached with Parafilm to perforated scintillation vial caps (1 plant per cap) prior to treatment. The caps were then attached to 20 mL plastic scintillation vials containing 15 mL of radiolabelled (25 pM 109CdCl2; 167 Bq mL-1) nutrient solution. Roots were exposed for 12–60 h, with the uptake solutions being replaced every 12 h. At the end of the absorption period, the shoots were excised just above the collar (5–7 mm above the root-shoot transition), and root-pressure xylem exudates were collected for 6 h on filter paper bullets (Whatman No. 41) placed on the stumps. To minimise evaporative loss of exudates, the filter paper bullet and stem stump were enclosed within a 0.6 mL microcentrifuge tube attached to the collar. Following sap collection, the filter paper bullet was weighed, dried and assayed for 109Cd.
Analyses
Roots and shoots were dried at 70°C for 3 d and then assayed for 109Cd and 65Zn using a two-channel gamma counter (Beckman Gamma 4000). Different maximum energy emissions of 109Cd (88 keV) and 65Zn (1116 keV) allowed simultaneous analysis of dual-labelled samples using the channels ratio method. Spent uptake and desorption solutions, and water rinses were collected to determine 109Cd and 65Zn depletion from the uptake solutions, and to verify recovery of added 109Cd and 65Zn. Depletion of 109Cd from the uptake solutions averaged 10% after 30 min (time-course and concentration-dependent experiments), 17% after 180 min (short-term time-course experiments), and 33% over all 12-h exposure periods (long-term time-course experiments). Depletion of 65Zn from the uptake solutions averaged 10% after 180 min (short-term time-course experiments), and 13% over all 12-h exposure periods (long-term time-course experiments). Recovery of added 109Cd and 65Zn typically exceeded 95 and 97%, respectively. Data were analysed by two-way analysis of variance after loge (raw data) or arcsine of the square root (percentage data) transformation when required to normalise the data. When a significant interaction (p < 0.05) was found between isolines and the treatment (time or concentration), Student's t-test was used to test for differences between the isoline pair at each level of the treatment (time or concentration).
References
Grant CA, Buckley WT, Bailey LD, Selles F: Cadmium accumulation in crops. Can J Plant Sci. 1998, 78: 1-17.
McLaughlin MJ, Parker DR, Clarke JM: Metals and micronutrients – food safety issues. Field Crop Res. 1999, 60: 143-163. 10.1016/S0378-4290(98)00137-3.
Meyer MW, Fricke FL, Holmgren GGS, Kubota J, Chaney RL: Cadmium and lead in wheat grain and associated surface soils of major wheat production areas in the United States. Agron Abs. 1982, 34.
Li YM, Chaney RL, Schneiter AA, Miller JF, Elias EM, Hammond JJ: Screening for low grain cadmium phenotypes in sunflower, durum wheat and flax. Euphytica. 1997, 94: 23-30. 10.1023/A:1002996405463.
Clarke JM, Norvell WA, Clarke FR, Buckley WT: Concentration of cadmium and other elements in the grain of near-isogenic durum lines. Can J Plant Sci. 2002, 82: 27-33.
Clarke JM, Leisle D, Kopytko GL: Inheritance of cadmium concentration in five durum wheat crosses. Crop Sci. 1997, 37: 1722-1726.
Hart JJ, Welch RM, Norvell WA, Sullivan LA, Kochian LV: Characterization of cadmium binding, uptake, and translocation in intact seedlings of bread and durum wheat cultivars. Plant Physiol. 1998, 116: 1413-1420. 10.1104/pp.116.4.1413.
Berkelaar E, Hale B: The relationship between root morphology and cadmium accumulation in seedlings of two durum wheat cultivars. Can J Bot. 2000, 78: 381-387. 10.1139/cjb-78-3-381.
Archambault DJ, Marentes E, Buckley W, Clarke J, Taylor GJ: A rapid, seedling-based bioassay for identifying low cadmium-accumulating individuals of durum wheat (Triticum turgidum L.). Euphytica. 2001, 117: 175-182. 10.1023/A:1004037901460.
Hart JJ, Norvell WA, Welch RM, Sullivan LA, Kochian LV: Characterization of zinc uptake, binding, and translocation in intact seedlings of bread and durum wheat cultivars. Plant Physiol. 1998, 118: 219-226. 10.1104/pp.118.1.219.
Hart JJ, Welch RM, Norvell WA, Kochian LV: Transport interactions between cadmium and zinc in roots of bread and durum wheat seedlings. Physiol Plant. 2002, 116: 73-78. 10.1034/j.1399-3054.2002.1160109.x.
Lasat MM, Baker AJM, Kochian LV: Physiological characterization of root Zn2+ absorption and translocation to shoots in Zn hyperaccumulator and nonaccumulator species of Thlaspi. Plant Physiol. 1996, 112: 1715-1722.
Cieśliński G, Van Rees KCJ, Huang PM, Kozak LM, Rostad HPW, Knott DR: Cadmium uptake and bioaccumulation in selected cultivars of durum wheat and flax as affected by soil type. Plant Soil. 1996, 182: 115-124.
Arao T, Ae N, Sugiyama M, Takahashi M: Genotypic differences in cadmium uptake and distribution in soybeans. Plant Soil. 2003, 251: 247-253. 10.1023/A:1023079819086.
Dunbar KR, McLaughlin MJ, Reid RJ: The uptake and partitioning of cadmium in two cultivars of potato (Solanum tuberosum L.). J Exp Bot. 2003, 54: 349-354. 10.1093/jxb/54.381.349.
Florijn PJ, Van Beusichem ML: Uptake and distribution of cadmium in maize inbred lines. Plant Soil. 1993, 150: 25-32.
Smeyers-Verbeke J, De Graeve M, François M, De Jaegere R, Massart DL: Cd uptake by intact wheat plants. Plant, Cell Environ. 1978, 4: 291-296.
Cataldo DA, Garland TR, Wildung RE: Cadmium uptake kinetics in intact soybean plants. Plant Physiol. 1983, 73: 844-848.
Costa G, Morel JL: Cadmium uptake by Lupinus albus (L.): Cadmium excretion, a possible mechanism of cadmium tolerance. J Plant Nutr. 1993, 16: 1921-1929.
Reid RJ: Mechanisms of micronutrient uptake in plants. Aust J Plant Physiol. 2001, 28: 659-666.
Pence NS, Larsen PB, Ebbs SD, Letham DLD, Lasat MM, Garvin DF, Eide D, Kochian LV: The molecular physiology of heavy metal transport in the Zn/Cd hyperaccumulator Thlaspi caerulescens. Proc Natl Acad Sci U S A. 2000, 97: 4956-4960. 10.1073/pnas.97.9.4956.
Marschner H: Mineral Nutrition of Higher Plants 2nd edition. London,UK: Academic Press; 1995.
Hardiman RT, Jacoby B: Absorption and translocation of Cd in bush beans (Phaseolus vulgaris). Physiol Plant. 1984, 61: 670-674.
Berkelaar E, Hale BA: Accumulation of cadmium by durum wheat roots: bases for citrate-mediated exceptions to the free ion model. Environ Toxicol Chem. 2003, 22: 1155-1161.
Homma Y, Hirata H: Kinetics of cadmium and zinc absorption by rice seedling roots. Soil Sci Plant Nutr. 1984, 30: 527-432.
Cohen CK, Fox TC, Garvin DF, Kochian LV: The role of iron-deficiency stress responses in stimulating heavy-metal transport in plants. Plant Physiol. 1998, 116: 1063-1072. 10.1104/pp.116.3.1063.
Piñeros MA, Shaff JE, Kochian LV: Development, characterization, and application of a cadmium-selective microelectrode for the measurement of cadmium fluxes in roots of Thlaspi species and wheat. Plant Physiol. 1998, 116: 1393-1401. 10.1104/pp.116.4.1393.
Kinraide TB: Ion fluxes considered in terms of membrane-surface electrical potentials. Aust J Plant Physiol. 2001, 28: 605-616.
Salt DE, Prince RC, Pickering IJ, Raskin I: Mechanisms of cadmium mobility and accumulation in indian mustard. Plant Physiol. 1995, 109: 1427-1433.
Florijn PJ, Nelemans JA, Van Beusichem ML: Evaluation of structural and physiological plant characteristics in relation to the distribution of cadmium in maize inbred lines. Plant Soil. 1993, 154: 103-109.
Harris NS, Taylor GJ: Remobilization of cadmium in maturing shoots of near isogenic lines of durum wheat that differ in grain cadmium accumulation. J Exp Bot. 2001, 52: 1473-1481. 10.1093/jexbot/52.360.1473.
Clarke JM, Leisle D, DePauw RM, Thiessen LL: Registration of five pairs of durum wheat genetic stocks near-isogenic for cadmium concentration. Crop Sci. 1997, 37: 297.
Parker DR, Norvell WA, Chaney RL: GEOCHEM-PC: A chemicalspeciation program for IBM and compatible personal computers.Chemical Equilibrium and Reaction Models. SSSA Spec Publ 42 Edited by: Loeppert RH, Schwab AP, Goldberg S. Madison, WI: Soil Science Society of America; 1995:253-269.
Acknowledgements
This research was funded through Natural Science and Engineering Research Council of Canada Strategic Grants 192991 and 246719 awarded to GJT. We thank John Clarke (Agriculture and Agri-Food Canada, Swift Current, SK) for the gift of durum wheat seeds, and Jodi Tomchyshyn for technical assistance.
Author information
Authors and Affiliations
Corresponding author
Additional information
Authors' contributions
NSH and GJT contributed equally to the conception, design and analysis of the study, and to preparation of the manuscript. NSH carried out the experiments. Both authors read and approved the final manuscript.
Authors’ original submitted files for images
Below are the links to the authors’ original submitted files for images.
Rights and permissions
About this article
Cite this article
Harris, N.S., Taylor, G.J. Cadmium uptake and translocation in seedlings of near isogenic lines of durum wheat that differ in grain cadmium accumulation. BMC Plant Biol 4, 4 (2004). https://doi.org/10.1186/1471-2229-4-4
Received:
Accepted:
Published:
DOI: https://doi.org/10.1186/1471-2229-4-4