- Methodology article
- Open access
- Published:
SIGI: score-based identification of genomic islands
BMC Bioinformatics volume 5, Article number: 22 (2004)
Abstract
Background
Genomic islands can be observed in many microbial genomes. These stretches of DNA have a conspicuous composition with regard to sequence or encoded functions. Genomic islands are assumed to be frequently acquired via horizontal gene transfer. For the analysis of genome structure and the study of horizontal gene transfer, it is necessary to reliably identify and characterize these islands.
Results
A scoring scheme on codon frequencies
Score_G1G2(cdn) = log(f_G2(cdn) / f_G1(cdn))
was utilized. To analyse genes of a species G1 and to test their relatedness to species G2, scores were determined by applying the formula to log-odds derived from mean codon frequencies of the two genomes. A non-redundant set of nearly 400 codon usage tables comprising microbial species was derived; its members were used alternatively at position G2. Genes having at least one score value above a species-specific and dynamically determined cut-off value were analysed further. By means of cluster analysis, genes were identified that comprise clusters of statistically significant size. These clusters were predicted as genomic islands. Finally and individually for each of these genes, the taxonomical relation among those species responsible for significant scores was interpreted. The validity of the approach and its limitations were made plausible by an extensive analysis of natural genes and synthetic ones aimed at modelling the process of gene amelioration.
Conclusions
The method reliably allows to identify genomic island and the likely origin of alien genes.
Background
A microbial genome is by no means a random agglomeration of genes. In addition to operons clustering functionally related genes, additional signals indicating structure can be detected: Base composition e.g. can vary strand-specifically [1] or the GC-content of a sequence may be correlated with its distance from the origin of replication [2]. Codon usage can be diversified depending on effects like translational efficiency [3]. Such parameters as well as the integration of bacteriophages or megaplasmids are responsible for structures perceptible on the genome level.
In addition, genomic island may result from horizontal gene transfer (HGT), regarded as an additional evolutionary means of biochemical or environmental adaptation [4]. Microbial genomes contain a varying portion of genes presumably acquired via HGT [5]. It was claimed that in some genomes this portion exceeds 20% of the genomic content. To study HGT, various methods based on the analysis of codon or amino acid sequences or the construction of phylogenetic trees were developed; reviewed e.g. in [6]. Each approach has its individual drawbacks and it might be that each method identifies a separate class of genes acquired in a different period of genome evolution [7]. Because of the mechanistic implications, the pieces of DNA captured via HGT frequently have a considerable length. Consequently, it has to be expected that a large fraction of alien genes occurs in clusters. This assumption is supported by biological evidence: Genes responsible for pathogenicity are often agglomerated in islands; see [8] and references therein. Huge clusters of genes expanding evolutionary fitness can also be found in non-pathogenic species. An example is the symbiotic island of size 611 kb in the genome of M. loti [9].
An exhaustive analysis of genomic islands has several aspects: It consists of the identification of clusters and the interpretation of gene function. For putatively alien genes (pA, acquired via HGT), their likely origin has to be predicted. The most reliable methods (if applied correctly) coping with the latter task rely on the construction and evaluation of phylogenetic trees. However, each such analysis requires the inference of relations within a gene family. For several reasons like the insufficient number of appropriate clades, it is still difficult to extend these phylogenetic studies to each gene of a complete genome. Therefore, methods were developed aimed at the identification of pA genes without the need for computing phylogenetic trees [5, 10–12]. These intrinsic methods assess (if applied to sequences) the composition on DNA or protein level and measure the deterioration from the typical case. One disadvantage of these surrogate methods [6] is that the origin of the open reading frames cannot be predicted.
In the following, I introduce a novel surrogate method that has the potential of predicting the putative source of a DNA sequence. It relies on the generally accepted assumption that codon usage in phylogenetically related species is similar [13, 14]. The algorithm is integrated into the software package named SIGI and is based on scores assessing codon usage in pairwise comparisons and the taxonomic evaluation of results. It will be shown that its sensitivity in identifying genomic islands is comparable to the most advanced methods like hidden Markov models (HMM). The combination of a sensitive detector with cluster analysis as implemented here, results in the reliable identification of islands and allows to reduce the number of false positive predictions. This seems to be a problem in many studies of HGT published so far [15]. The validity of the predictions is made plausible by an exhaustive statistical analysis based on natural and synthetic genes. These predictions are one function of SIGI. In addition, it identifies gene clusters originating from additional signals like codon usage bias aimed at the optimisation of translational efficiency.
Results
The following paragraphs are organized as follows: First, the predictive power of the new approach named MPW (see Methods) is compared to methods already introduced in order to validate its ability to find compositionally atypical (CA) genes and genomic islands. Then, the performance of the algorithm in identifying the putative source of genes is studied. Finally, predictions deduced for completely sequenced genomes are presented.
Performance of the scoring system in identifying CA genes
An impressive number of methods for the identification of CA and pA genes was introduced so far; e.g. [11, 16–18], see also [7]. In order to compare the predictive power of methods and to evaluate the new approach, I used as a test set the genes annotated on chromosome two of V. cholerae. This chromosome contains an integron island of size 125.3 kbp, which includes genes VCA0271 to VCA0491 [19]. For the analysis, two groups were formed consisting of genes VCA0010 to VCA0230 (group cl) and genes VCA0271 to VCA0491 (group gi). For each gene, codon usage contrast, δ* difference, dicodon difference – as defined in [18] – and h MPW (gene) as described in Methods were determined. These scores were accumulated parameter-wise in pairs of histograms H cl and H gi . The decision-strength of each parameter was assessed by incrementing a running cut-off c_o r and reading from H cl and H gi the fraction of genes accumulated below c_o r . Resulting curves are plotted in figure 1. The experiment clearly shows that the new algorithm outperforms the methods, which evaluate deviation from mean frequencies of codons, dicodons or dinucleotides. In addition, the plot demonstrates that codon usage contrast (in the following abbreviated as CU) is the second best indicator on the test set.

Selectivity of four methods for the identification of compositional atypical genes. Two sets were analysed consisting of genes VCA0010 to VCA0230 (control group) and genes VCA0271 to VCA0491 (belonging to the integron island) from chromosome two of V. cholerae. For each gene, the indicators codon usage contrast (CU), δ* difference, dicodon usage (DC) and h MPW (gene) (as introduced here) were determined as described, the values were accumulated set-wise in histograms. Any position on a curve gives on the two axes the fraction of genes below the corresponding cut-off value.
Lawrence and Ochman [14] have developed a surrogate method that combines analysis of GC-content on the first and third codon position, of synonymous codon usage, of positional homology and of BLAST hits (in the following abbreviated as CA LO ). The results achieved for the E. coli K-12 genome are available ftp://ftp.pitt.edu/dept/biology/lawrence. In figure 2, for all genes of this genome, GCB scores – signalling translational efficiency [20] – were plotted vs. CU-contrast and MPW score values. 402 of the 569 genes annotated as CA with the MPW-approach were also classified as CA LO . This number of coincidences is the 4-fold of the fraction expected to occur merely by chance and is much higher than the overlap of any two other methods tested so far; see [6]. Therefore, it can be deduced that a significant portion of the CA genes were acquired via HGT and that the periods of genomic evolution addressed by the CA LO and the MPW approach overlap to a great extend. The plot makes also clear that putatively highly expressed (PHX, see Methods) genes have to be excluded in applying surrogate methods. At least some of the genes identified as compositional atypical with the CA LO method were PHX. Because of the highly specific codon usage, it is unlikely that these genes have been acquired via HGT (see figure 2).

Plot of GCB-scores versus CU-contrast values for all genes of E. coli K-12 and the classification of compositional atypical genes. For all genes of the genomic data set, the two parameters were determined, converted to z-values and plotted as small dots. A high GCB-score is an indicator for adaptation to translational efficiency. Genes annotated as putatively alien according to the classification CA LO and/or by using the MPW approach were labelled. The set CA LO AND MPW consists of those genes identified as compositional atypical by both methods.
Fraction of CA genes and their location
It is known that the number of pA genes varies significantly among microbial genomes [21]. Some reasons explaining these differences are the nature and the efficiency of the transformational system or the assortment of the ecological niche the species occupy. In table 1, for a number of species the fraction of CA genes is given and compared to values published for HGT. For most of the genomes listed in [21], the fractions of genes identified as compositional atypical are similarly high. The MPW approach identified for the genomes of Synechocystis (CA LO = 16.6% / MPW = 5.6%) and A. aeolicus (9.6% / 3.3%) a lower and for A. pernix (3.2% / 6.1%) a higher amount of CA genes. For the genomes of M. leprae, T. thermophilus, A. fulgidus, C. acetobutylicum, P. horikoshii, Halobacterium, B. burgdorferi, A. aeolicus and Nostoc, the fraction of CA genes was below 5% and for the genomes of B. melitensis, C. crescentus, M. jannaschii, T. pallidum, C. jejuni, M. thermautotrophicus, M. kandleri, P. aerophilum, C. perfringens, T. elongatus, R. conorii and C. muridarum, it was below 3%. This was also true for the genomes of D. radiodurans and H. pylori, which is in contrast to already published findings [21]. In the genomes of N. meningitidis, R. prowazekii, F. nucleatum, Buchnera, M. genitalium, M. pulmonis and U. urealyticum the fraction of CA genes was below 1%. These values correspond well with findings concerning the mosaic structure of genomes: In N. meningitidis only 2.2% of the genome are meningococcus specific [22]. In the sequences of many microbial genomes, a noticeable skew in the usage of guanosine and cytosine residues is detectable and frequently used to identify the origin of replication. An extensive survey of genomes based on such methods [2] identified six chromosomes not presenting a significant structure: Those of Nostoc, Synechocystis, Buchnera, R. conorii, B. burgdorferi and A. aeolicus. Clusters of pA genes with deviating codon usage would presumably influence the local GC-content, which is obviously not the case in the considered genomes. The two chromosomes of R. solanacearum (>10% of CA genes each) have both a mosaic structure [23].
The genome of B. subtilis has been assessed using a system of hidden Markov models in order to detect heterogeneities in DNA composition [24]. Table 2 is an extended version summing up these findings and the location of CA clusters identified with the MPW approach. The table demonstrates that both algorithms identify with similar efficiency regions of deviating DNA composition.
In a critical survey, four surrogate methods were compared [6] by studying the intersections of those sets of genes identified as pA by the various methods. It turned out that only the CA LO approach and a method based on hidden Markov models tagged the same genes as pA more frequently than expected by change.
In [25], the genomes of two Xanthomonas pathogens were compared: Xanthomonas axonopodis pv. citri (Xac) and Xanthomonas campestris pv. campestris (Xcc). To identify unique genes the authors BLASTed each gene of one genome against all genes of the second one and analysed the hits. For the following comparison those genes were named unique that had no BLAST hit with an E-value < 10-20 in the second genome. These data sets were downloaded from http://cancer.lbi.ic.unicamp.br/xanthomonas. As the MPW approach was designed to predict clusters only, unique genes lying isolated were removed. The resulting data sets were compared against the MPW prediction. For Xac, 425 genes were identified as unique; the MPW approach annotated 488 genes as CA. 248 genes were both unique and CA. In the Xcc data set consisting of 4240 genes, 340 had the attribute unique and 454 the attribute CA, 213 genes had both attributes. If these attributes were completely unrelated, one would expect for Xcc the following number n of genes with both attributes: n = (454/4240 × 340/4240) × 4240 = 36. In both genomes, the number of CA genes labelled as unique is more the five times the expected value.
Altogether, these findings support the notion that the MPW approach identifies to a great extend the same class of genes as hidden Markov models or the CA LO method. An example for a summary view of SIGI's output is given in figure 3.

Summary view of SIGI's annotation for the genome of S. agalactiae. Each symbol labels a single gene (product). Meaning of the characters: "R" tRNA gene, "x" or "X" two levels of bias in putatively highly expressed genes, "I" integrase, "T" transposase, "H" hypothetical protein identified as CA, "G" a gene annotated with a function and identified as CA, "." a gene classified as insuspicious.
Identification of ameliorating genes and excluding false predictions
Beginning with the acquisition of an alien gene, its codon usage will be modulated depending on selective constraints and mutational pressure affecting the recipient's genome. This process was named amelioration [14]. One might argue that the codon usage of an ameliorating gene differs significantly from both the donor's and the acceptor's codon frequencies and may thus cause false predictions. In order to test the robustness of the MPW approach with respect to the amelioration process, synthetic genes consisting of random codon sequences of different length between 100 and 500 codons were generated. Each test set consisted of 500 sequences. Codons were selected randomly according to the frequency values as deposited in the CUTG_RF database (see Methods). For each test set, two species REC (recipient) and DON (donor) and a value FRAC (0.0 ≤ FRAC ≤ 1.0) were chosen. Codons were drawn according to the frequency tables CDN REC or CDN DON . FRAC determined, how often CDN DON was selected as a source for the determination of codons frequencies. For the analysis described below, for each combination of a donor and an acceptor, nine data sets were generated according to the FRAC-values 0.0, 0.05, 0.10, 0.25, 0.50, 0.75, 0.90, 0.95, 1.0. These test sets served as a crude model for the amelioration process of genes originating from the donor in the recipient's genome. Test sets were generated for four species. M. loti (GC-content 63%), E. coli K-12 (GC-content 52%), P. horikoshii (GC-content 42%) and C. acetobutylicum (GC-content 31%) were used as acceptors and different genomes were selected as donors. The donors were chosen individually, according to phylogenetic relation and their similarity in codon usage with respect to the acceptor. Table 3 lists these combinations used to generate synthetic genes.
It is known that the mean GC-content at the three codon positions is correlated with the mean GC-content of the genome [26]. A significant deviation of the position-specific GC-content from expectation values derived from the mean GC-content of a gene was interpreted as a signal identifying ameliorating genes [14]. In order to determine a precise measure for the calculation of position-specific GC-values, 89 microbial genomic data sets were analysed and used for linear regression. The following formulas were deduced:
GCexp 1= 0.761 GC mean + 17.9
GCexp 2= 0.481 GC mean + 15.6
GCexp 3= 1.732 GC mean - 33.0
GC mean is the mean GC-content of a gene set under study; GC exp 1.. GCexp 3are the expected GC-content values of codon positions 1 to 3. To evaluate the GC composition of a gene, expectation values GC exp i as indicated above were derived from its mean GC-content and compared to the position-specific values GC i . An indicator already used to signal amelioration [14] is the Manhattan distance GC_dist assessing codon positions 1 and 3:
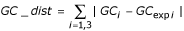
The underlying model implies that the mean GC_dist value is larger in the midst of the amelioration interval. The mean deviation should be minimal for newly acquired genes or those having nearly gained the donor's composition. Thus, one might expect that genes with high GC_dist values generate the largest number of false predictions. In table 4, which summarizes the results obtained for predicting the putative source of synthetic sequences, only entries having a GC_dist value below the cut-off value AMELI were analysed via the MPW approach. AMELI was incremented from 0.05 to 0.25. A putative source was regarded a wrong prediction, if it was neither a taxon linking the donor with the root of the taxonomic tree nor a taxon linking the acceptor with the root. The presented predictions were derived from the taxonomical relation of the k = 3 highest scoring species (see Methods). Consequently and in the worst case, the term "cellular organism" or the name of a superkingdom was predicted as the putative source. Predictions based on k = 2 pairwise scores were in many cases wrong (data not shown). Interestingly, the number of false predictions is extremely low, if the acceptor's GC-content is above 40% and if the Manhattan distance to the acceptor's codon usage is below 15. The results obtained for FRAC = 0.95 clearly indicate that the algorithm is robust as long as the codon usage is species-specific: Among 24 cases, only the combination of the acceptor M. loti and the donator F. nucleatum generated more than 20% false positive predictions.
If the random sequences used for the analysis are a proper model for the amelioration process, then the following problem arises: The result suggests that the amelioration of a sequence originating from a species with very dissimilar codon usage causes misleading signals. In addition, the results presented in table 4 do not show a correlation of the relative number of false positive predictions with the GC_dist value. Therefore, and at least for the data set used here, the interpretation of the GC_dist value was no indicator to identify ameliorating sequences. If ameliorating sequences of that kind were frequent in genomes, then the interpretation of codon usage or signatures as in [27] would be questionable. However, there is one argument that might resolve the dilemma: It was made plausible that the range and the frequency of HGT is constrained by selective barriers [15] and one might expect that a codon usage too dissimilar to the acceptor's one prevents an expression level necessary to guarantee the survival of a gene in the acceptor's genome.
A second test for the predictive power was based on the analysis of native genes selected in 20 species representing the bacterial and archeal superkingdoms. From the genomes of A. fulgidus, M. acetivorans, T. acidophilum, P. horikoshii, T. maritima, D. radiodurans, C. glutamicum, L. lactis, S. pneumoniae, B. subtilis, E. coli, Y. pestis, H. influenzae, N. meningitidis, H. pylori, A. tumefaciens, M. loti, R. conorii, C. pneumoniae and M. pulmonis, genes annotated by SIGI as putative native ones were extracted. Each data set consisted of more than 200 genes. During the analysis and for all data sets, each of the mentioned species was regarded as the putative acceptor resulting in 20 × 20 individual tests. For all genes, the putative source was predicted individually as described (see Methods). In 14 of the 20 data sets, the highest score identified the source correctly for more than 90% of the genes on the level of the taxonomical family irrespective of the choice of the putative acceptor. Less specific were the results for the data sets extracted from the genomes of L. lactis (72% correct predictions on the family level), S. pneumoniae (81%), C. glutamicum (88%), B. subtilis (88%), Y. pestis (83%) and from genes of chromosome 1 of D. radiodurans (59% correct predictions on the phylum level). Inferring the putative source from three high scoring pairwise comparisons as described below, reduced – as expected – the specificity of the taxonomical classification. However, the number of false predictions decreased drastically: For all cases besides D. radiodurans, less than 5% of the sources were misclassified on the level of the taxonomic class. In the worst case, i.e. for D. radiodurans genes, 32% of the predictions were wrong on the phylum level. These findings suggest that codon usage in the extracted gene set of D. radiodurans is unspecific and has to be studied in more detail. In no case, more than 1% false classifications were generated on the level of the superclass. This result indicates that codon usage in Bacteria and Archaea is quite distinct.
Predicting the origin of CA genes
It is known that genomic islands are inhomogeneous in composition and have a mosaic structure, as they are the result of a multistep process [8]. For a first analysis of the genomes however, I identified genomic islands annotated relatively homogeneously with respect to the putative donor.
Each Salmonella genome has approximately 12 fimbria operons frequently involved in virulence [28]. In S. typhimurium, the operons fim, saf, std and sth were identified as CA, bcf, lpf, stc, stf, sti and stj were silent. In S. enteritidis, sef, stb, std, ste and tcf were identified as CA, bcf, saf, sta, stc, stg and sth were inconspicuous. The integrated phage genomes Gifsy-1, Gifsy-2, Fels-1 and Fels-2 were CA. In many cases, for these islands the taxa "Bacteria" or plasmids are predicted as putative source, indicating an unspecific codon usage. The bias seen in the fimbria operons might be due to the strong selective pressure imposed by the host immune system. Based on the analysis of the ycdB gene, it was claimed that genomic islands of low GC-content were acquired from Lactococcus lactis [29]. SIGI gave the following annotations for the most similar sequences of ycdB: AAC75047 of E. coli K-12 predicted as CA originating from Bacilli, second most similar codon usage (hit) Lactococcus, CAD06974 of S. enteritidis CA (Bacilli, first hit Lactococcus), AAL23317 of S. typhimurium was not annotated as CA, SF2054 of S. flexneri CA, (Bacilli, first hit Lactococcus).
In Salmonella enterica, several CA clusters were identified. In the following list, for some clusters the positions, gene names, coded proteins and putative sources are given: 1004 kb – 1053 kb contains genes annotated as putative bacteriophage proteins, originating according to SIGI from plasmids or Enterobacteriaceae; 1625 kb – 1651 kb, ssa genes, coding for a type III secretion system, Enterobacteriaceae; 2118 kb – 2135 kb, rfb, putative transferases, inhomogeneous codon usage; 2863 kb – 2900 kb, prg and sip, pathogenicity 1 island effector proteins, spa, surface presentation of antigens, inv, secretory proteins, Enterobacteriaceae; 3830 kb – 3838 kb, ccm heme exporter protein, Proteobacteria; 3930 kb – 3941 kb, waa, involved in the lipopolysaccharide core biosynthesis, Enterobacteriaceae; 4403 kb – 4543 kb, topB, a topoisomerase, pil, vex polysaccaride export, Enterobacteriaceae, plasmids.
The codon usage of most CA genes identified in Bacillus subtilis (see table 2) is unspecific. If SIGI predicts a specific taxon, it is a closely related clade. A similar result was observed for the genome of Escherichia coli O157:H7. 728 genes were identified as CA, the codon usage table causing the highest score was in 137 cases derived from a plasmid, 349 times it was from a species belonging to the gamma subdivision. All prophages and prophage-like elements known to be integrated into the genome [30] were found plus several additional CA clusters. All known pathogenicity islands of V. cholerae are CA, among these were the recently identified islands on chromosome one, named "seventh pandemic islands" [31]. For a detailed analysis, see the material deposited on our webserver.
In the genome of the α-Proteobacterium Caulobacter crescentus, only 2.5% of the genes are CA. Several genes clustered in the area from 621 kb – 694 kb were predicted as originating from the Rhizobiaceae group: CC0575 coding for a putative beta-lactamase (p1 = 5 × 10⁻⁴, p2 = 9 × 10⁻⁵), CC0576, it's product is an asparaginase family protein (p1 = 0.01, p2 = 9 × 10⁻⁵) or CC0618, cysG coding for a siroheme synthase (p1 = 0.01, p2 = 9 × 10⁻⁵). The indices p1 and p2 are explained in Methods. A second cluster at 2.90 kb – 2.95 kb contains the genes for the conjugal transfer protein trbI and several transposases. The codon signature is inhomogeneous, dominated by species of the Rhizobiaceae group.
Haemophilus influenzae Rd is a small, Gram-negative bacterium; the only natural host is human. For 15 genes, the γ-Proteobacterium Shewanella was predicted as putative source. 12 of these hits were clustered in the region 1572 kb – 1590 kb which belongs to an island extending from 1555 kb – 1595 kb. It contains among genes for hypothetical proteins fepC and genes coding for Mu proteins like muA. Recently, a Shewanella species was identified as human pathogen [32] making the prediction plausible. As the GC-content of H. influenzae is 38%, these predictions have to be interpreted with care (see above, results for ameliorating genes).
In many cases, restriction-modification enzymes were identified as CA like in Nostoc. A genomic island (3278 kb – 3289 kb) containing a type 1 restriction modification enzyme follows a tRNA-Ala gene and a transposase. A second enzyme of that type is located in the genomic island (4186 kb – 4220 kb) following a tRNA-Gly. These genes are predicted as originating from Bacilli and Chlamydophila.
In the genome of Streptococcus pyogenes, 131 genes are annotated as "phage associated". However, only 50 of these genes were identified as CA. A CA island spans from 884 kb to 895 kb containing a putative methyltransferase and the srt system involved in lantibiotic production; the putative source is diffuse.
It is known that the genome of Mesorhizobium loti contains a huge symbiosis island (4645 kb – 5256 kb) of size 611 kb [9]. SIGI predicts most of these genes as originating from the Rhizobiaceae group. The hypothetical protein MLR6371 has the codon signature of the beta subdivision. Examples for additional CA clusters are: 341 kb – 362 kb coding for unknown proteins around a bacteriophage integrase, genes are similar in codon usage to plasmids and Rhizobiaceae; 779 kb – 827 kb codes several transferases; 843 kb – 861 kb containing genes for an adenylate cyclase, putatively originating from the Rhizobiaceae group (p1 = 0.04, p2 = 3 × 10⁻⁵) and rsp, the rhizobiocin secretion system; 2592 kb – 2610 kb containing a cyclase and a glycosyltransferase gene; 3219 kb – 3234 kb with genes for a DNA invertase rlgA and an excisionase; 3705 kb – 3755 kb containing genes for a glycosyltransferase, a DNA polymerase, chloramphenicol-acetyltransferase, heat shock proteins, codon usage most similar to Rhizobiaceae group; 5714 kb – 5742 kb containing genes for elements of an ABC-transporter, methyltransferases, hydrolases; 6580 kb – 6681 kb genes for hypothetical proteins, an ABC-transporter, a DNA modification-methylase, a histidine-kinase and a site-specific recombinase, the codon usage is most similar to that of the Rhizobiaceae group.
For a complete listing of the results, see the material deposited on the web server http://www.g2l.bio.uni-goettingen.de. For each genome, results are available in a tabulated version and a format readable by the gene browser ARTEMIS [33].
Discussion
It was argued that codon usage and atypical GC-content are no reliable indicators for the study of horizontally transferred genes [34]. An analysis of positional orthologous genes in E. coli and S. typhimurium came up with a similar result [35]. Interestingly the genes referred to as being classified as false positives in E. coli K-12 (gloB, gadB, yheB) with the CA LO approach were not classified as CA by the MPW method. Definitely, the number of false positive predictions can be reduced by applying a clustering method as introduced here. The risk of missing a large fraction of pA genes should be minimal, as the pieces of transferred DNA have usually a considerably length [8], although there exist exceptions like in the genome of Neisseria [22].
The assumption that surrogate methods might overlook genes acquired by horizontal transfer might be valid for more ancient events, recently acquired genes seem to be detected to a great extend by surrogate methods [2]. Lawrence and Ochman estimated the age of imported genes [5]. The conclusion was that most are relatively recent, i.e. acquired within the last few million years; see e.g. [36]. This suggests that older imports have been purged from the genomes presumably because these genes did not improve fitness [15]. If this argument is valid, there is no need to search for huge amounts of ancient pA genes.
The highly consistent findings of the HMM and the MPW approach for the B. subtilis genome confirm specificity and sensitivity of the MPW method. However, there might be two problems: Predicting the false donor and amelioration. The most convincing proof for the correctness of SIGI's prediction are concordances with phylogenetic studies. One example of consistent results is the analysis of the ycdB gene presented above. However, in many cases, genes identified as pA with other methods were not part of a CA cluster. This was the case for gltB and ino1 of Thermotoga maritima identified as archeal [37], or the events of HGT described for D. radiodurans [38]. The analysis of synthetic genes showed that the risk of predicting a false source is high, if the codon usage of the donor is extremely different. There is however biological evidence that such HGT events are rare. Therefore, most of SIGI's predictions are reliable on a statistical level. The analysis of the domain structure of aminoacyl-tRNA synthetases revealed a complex history of HGT events [39]. In no genome, the MPW method annotated an aminoacyl-tRNA synthetase as CA. This might indicate the limitations of the approach, which is limited to signals on the codon level.
The GC-content decreases near the replication terminus of several microbial species. The AT richness of the terminus region could be caused by the replication machinery or the DNA repair system [2]. This deviation might be the source for classifying genes incorrectly as CA. In many cases, the GC-content of pathogenicity islands is however lower than the average content – see examples in [22, 31] – and it might be that genomic islands were imported preferentially opposite of the origin of replication. In addition, not all genomic islands are AT rich: the area between 1555 kb and 1595 kb in the genome of H. influenzae consists of 40 genes having a GC-content that is higher and 11 genes having a GC-content lower than the mean GC-content of the genome. If GC-content is determined gene-wise, then for 45% of the genomes analysed here, more than 75% of the genes have a lower than mean GC-content, which is in agreement with [40, 41]. However, 18% of the genomes harbour in GIs more than 50% of CA genes having a higher GC-content. An extreme case is the genome of S. solfataricus, where 90% of CA genes have a GC-content higher than the mean value of 35%.
In principle, the MPW should also identify genomic islands whose GC-content is similar to the rest of the genome as long as the codon usage is different. Even a similarity of codon usage as detected in thermophilic bacteria of different clades [42] will not cause false predictions: because of the interpretation of taxonomic relation between hits, the annotation will in these cases be less specific but not false.
There are several options to improve SIGI: The integration of more codon usage tables and additional indicators like those introduced in [11] or [27] may further enhance its predictive power. Applying models for the amelioration process [14, 34] may allow to "reameliorate" genes and to determine the source of pA genes more specifically. Finally, a statistical model for the MPW approach has to be developed.
Conclusions
SIGI is able to detect genomic islands with high sensitivity. These areas are also candidates for HGT events. Studying such events, SIGI complements methods based on phylogenetic approaches. The analysis of the taxonomical relation among putative donors makes clear that a simple comparison of codon usage may create misleading predictions.
Methods
A scoring scheme to test relatedness of codon usage
The simplest statistical model describing genes as a sequence of codons assumes that codons occur independently from each other. For this model, the Neyman-Pearson lemma assures that a function of the type

is optimal to decide, whether gene = start codon, cdn1, ccdn2......cdn n is a member of the family G1 characterized by codon frequencies fG 1(cdn j ) or belongs to family G2 having codon frequencies fG 2(cdn j ). As a result of test theory, it is known that there exists no other function with a decision strength greater than expression (I). Applying the logarithm and normalizing for gene length gives:
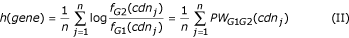
Now h(gene) is the sum of species-specific log-odds scores PWG 1G 2(cdn) divided by the number of codons constituting the gene. Scores of that type were utilized frequently and are supported by a sound theory [43]. Recently it was shown that a similar approach is appropriate to quantify codon usage bias associated with translational efficiency [20].
The score values PWG 1G 2(cdn), which were here always deduced from codon frequencies among synonymous codons, can be used to decide whether codon usage in gene resembles more the prevalences of species G1 or species G2. If gene is from genome G1 and if h(gene) is >> 0 then its codon usage is more similar to G2. Therefore, and if G2 is taxonomically distinct, the gene under study must be regarded an alien gene and genome G2 might be its source. In the study presented here, a putative source was predicted for genes longer than 100 codons only. This lower limit for gene length was introduced in order to reduce statistical variation due to small sampling size.
As it was one aim of the study to predict the putative source of compositional atypical genes, it was necessary to generate a sufficiently large number of score sets covering most of the possible origins of taxonomically related species. A prerequisite for the calculation of these scores PWG 1G 2are codon usage tables. Their compilation was initiated with data sets derived from completely sequenced microbial genomes, which were publicly available. Frequency values fG 2(cdn j ) were determined from those genes not annotated as hypothetical or with a putative function. It is known that codon frequencies in putatively highly expressed (PHX) genes deviate significantly from mean values [3, 44]. For each gene, z-scores were determined for CU contrast [18] and GCB-values [20] (compare figure 2). A gene was regarded as PHX, if the combination of the two scores exceeded a predefined cut-off value. This initial set was supplemented with entries from the CUTG database [45] in the version as of Aug. 2002. From this collection, only those microbial entries were accepted that contained more than 6400 codons. If more than one frequency table existed for the same taxonomic species, the data set deduced from the largest number of codons was processed further. After data collection, similarity of codon usage among species was controlled by calculating pairwise a Manhattan-like distance among codon usage tables. This distance values were used to select the final set CUTG_RF of codon frequencies. For all elements of CUTG_RF, it was confirmed that the most similar species on codon usage belongs to the same taxonomic class or superclass. This step and the other precautions mentioned above were introduced in order to guarantee taxonomic relatedness among the entries and to eliminate codon usage tables presumably derived from a non-representative sample of a genome. The collection was supplemented with codon usage tables of plasmids. Altogether CUTG_RF consisted of n RF = 371 entries used for the calculation of scores PWG 1G 2(cdn) at position G2. The codon frequencies fG 1(cdn j ) of the genome G1 under study were determined from those genes not annotated with the terms "hypothetical" or "putative" and which were no PHX genes.
For the analysis of each gene of a genome G1, its codon usage was evaluated in a multiple pairwise test (MPW) using n RF individual scoring schemes PWG 1G 2(cdn). The species G2 max causing the highest score h MPW (gene) was considered a putative source, if h MPW (gene) exceeded a cut-off value. In order to quantify the statistical relevance of the prediction, two parameters p1 and p2 were introduced. p1 gives the fraction of genes in G1 that achieved a score at least as high as h MPW (gene), if evaluated with the scoring scheme PWG 1G 2max(cdn). A p1- value of 0.01 e.g. indicates that 1% of the genes in G1 have a score equal to or greater than h MPW (gene) if compared to the codon usage of G2 max . The second parameter p2 was derived from a taxonomic rating of those k = 2 or 3 species G21-G2 k triggering the k largest score values for gene. The basis for the analysis was a taxonomic tree generated by using material obtained from the ftp-server of the NCBI ftp://ftp.ncbi.nih.gov/pub/taxonomy/. The nodes that represent species belonging to the set CUTG_RF were labelled with an indicator. To calculate the parameter p2, the position of the leaves G21... G2 k were used to identify the nearest node (ancestor in the taxonomy tree) t1 that subsumes the k leaves. If t1 is the ancestor of those n t species belonging to CUTG_RF, then the probability p2 of picking by chance k species belonging to the taxonomic group t1 can be calculated as
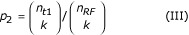
Formula (III) was adapted accordingly, if nt 1was smaller than k. The identification of taxon t1 and the p2 value allow to determine the specificity of codon usage. If the high scoring species are taxonomically unrelated, t1 will be unspecific and p2 relatively large. A specialized codon usage will result in small p2 values and a more specific taxon.
Identification of CA clusters
The concepts introduced so far allowed to characterize individual genes and to quantify related scores statistically. Now, it was necessary to assess the set of all h max (gene) values in order to derive a cut-off which discriminated those values h(gene) > 0 that deviated significantly from expected fluctuations. Because of the focussing on identifying clusters of CA genes, a statistical approach could be utilized to eliminate false positive predictions. To identify genomic islands and to dynamically adapt the cut-off for each genome individually, a two-pass strategy was used. During the first pass, for each gene with number i, all n RF scores were determined and h MPW (gene i ) was identified. A text string genome was created according to the following instruction:
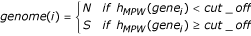
For the string genome the global frequency f glob (S) was determined and clusters SSSSS indicating a successive sequence of at least five CA genes were localized. These clusters were extended in both directions until the local frequency f loc (S) fell below the value 2 × f glob (S). The h MPW (gene) values of the genes in the extended clusters and the remaining ones were accumulated in two histograms h_cl and h_rem. From the histogram h_cl, the cut-off c_o2 for round two of the clustering process was derived as the h MPW value exceeded by 95% of the values determined for genes in extended clusters. c_o2 allows to estimate the error of not classifying a CA gene correctly: Applying c_o2 on h_rem gives the number of genes having a score above this cut-off and not being classified as a CA gene. Using cut-off c_o2, the clustering algorithm was reinitiated and the genes classified as belonging to extended clusters in round two were annotated as being CA. The cut-off for round one was always set to 0.025, a value deduced from the analysis of chromosome two of V. cholerae (see Results).
There were several reasons to design the algorithm as described: The main argument for focusing on clusters was a combination of biological evidence and statistical principles that help to increase the reliability of the prediction. First, it is known that genomic islands frequently have a size of 10 – 200 kb [8]. Second, if the probability of annotating a gene as CA is p(S) then the probability for a CA cluster of n successive genes is p(S)n, if independency is assumed. Thus, for realistic values of p(S) and n it is highly unlikely that such a cluster occurs merely by chance. Even if we consider a large value like p(S) = 0.3, then the probability p(S)5 for a cluster of size 5 (as assumed above) is < 2.5 × 10⁻³. A rough estimation (1 / p(S)5) gives that then one among 400 of such clusters occurs merely by chance and is a false positive classification. This situation allows to gain high sensitivity in identifying individual CA genes and to deliberately adjust the cut-off level as described above. As mentioned, the calculation is based on the assumption that the classification of adjacent genes is independent of the context. Assuming independency is a simplistic model, however a rough approximation, if compared to findings in E. coli: 80% of transcription units (which subsume operons) have less than five genes [46].
The factor 2.0 used in the expression 2 × f glob (S) for the propagation of extended clusters was inferred from the analysis of the integron island on chromosome two of V. cholerae (see Results). The exact value of this parameter did not critically influence the identification and localization of the integron island (annotation as from [19], data not shown). In general, the algorithm used for the extension of clusters resembles principles implemented in BLAST for the identification of optimal high scoring segment pairs [47].
Data sets (accession numbers in brackets)
Archaea
Archaeoglobus fulgidus (NC_000917), Aeropyrum pernix (NC_000854), Halobacterium sp. NRC-1 (NC_002607), Methanothermobacter thermautotrophicus (NC_000916), Methanocaldococcus jannaschii (NC_000909), Methanosarcina acetivorans (NC_003552), Methanosarcina mazei (AE008384), Pyrococcus abyssi (NC_000868), Pyrococcus horikoshii (NC_000961), Sulfolobus solfataricus (NC_002754), Sulfolobus tokodaii (NC_003106), Thermoplasma acidophilum (NC_002578), Thermoplasma volcanium (NC_002689).
Bacteria
Agrobacterium tumefaciens (AE007869, AE007870), Aquifex aeolicus (NC_000918), Bacillus halodurans (NC_002570), Bacillus subtilis (NC_000964), Brucella melitensis (NC_003317, NC_003318), Borrelia burgdorferi (NC_001318), Buchnera sp. APS (NC_002528), Campylobacter jejuni (NC_002163), Caulobacter crescentus (NC_002696), Chlamydia muridarum (NC_002620), Chlamydia trachomatis (NC_000117), Chlamydophila pneumoniae J138 (NC_002491), Chlamydophila pneumoniae AR39 (NC_002179), Clostridium acetobutylicum (NC_003030), Clostridium perfringens (NC_003366), Corynebacterium glutamicum (NC_003450), Deinococcus radiodurans (Chromosome 1, NC_001263), Escherichia coli K-12 (NC_000913), Escherichia coli O157:H7 EDL933 (NC_002655), Fusobacterium nucleatum (NC_003454), Haemophilus influenzae Rd (NC_000907), Helicobacter pylori 26695 (NC_000915), Helicobacter pylori J99 (NC_000921), Lactococcus lactis subsp. Lactis (NC_002662), Listeria innocua (NC_003212), Listeria monocytogenes (NC_003210), Mesorhizobium loti (NC_002678), Methanopyrus kandleri (NC_003551), Mycobacterium tuberculosis CDC1551 (NC_002755), Mycobacterium tuberculosis H37Rv (NC_000962), Mycoplasma genitalium (NC_000908), Mycobacterium leprae strain TN (NC_002677), Mycoplasma pneumoniae (NC_000912), Mycoplasma pulmonis (NC_002771), Neisseria meningitidis Z2491 (NC_003116), Nostoc sp. PCC 7120 (NC_003272), Oceanobacillus iheyensis (NC_004193), Pasteurella multocida (NC_002663), Pseudomonas aeruginosa (NC_002516), Pyrobaculum aerophilum (NC_003364), Ralstonia solanacearum (NC_003295, NC_003296), Rickettsia conorii (NC_003103),Rickettsia prowazekii (NC_000963), Salmonella enterica (NC_003198), Salmonella typhimurium (NC_003197), Shigella flexneri (NC_004337), Sinorhizobium meliloti (NC_003047), Staphylococcus aureus subsp. aureus N315 (NC_002745), Staphylococcus aureus strain Mu50 (NC_002758), Streptococcus agalactiae (NC_004116), Streptococcus pneumoniae R6 (NC_003098), Streptococcus pneumoniae TIGR4 (NC_003038), Streptococcus pyogenes (NC_002737), Synechocystis sp. PCC6803 (NC_000911), Thermoanaerobacter tengcongensis (NC_003896), Thermosynechococcus elongatus (NC_004113), Thermotoga maritima (NC_000853), Treponema pallidum (NC_000919), Ureaplasma urealyticum (NC_002162), Vibrio cholerae (NC_002505, NC_002506), Xanthomonas axonopodis (NC_003919), Xanthomonas campestris (NC_003902), Xylella fastidiosa (NC_002488), Yersinia pestis (NC_003143).
The data sets for Thermus thermophilus and Picrophilus torridus were preliminary data prepared at the Göttingen Genomics Laboratory.
References
Lobry JR: Asymmetric substitution patterns in the two DNA strands of bacteria. Mol Biol Evol 1996, 13: 660–665.
Daubin V, Perrière G: G+C3 structuring along the genome: a common feature in Prokaryotes. Mol Biol Evol 2003, 20: 471–483. 10.1093/molbev/msg022
Sharp PM, Li WH: The codon adaptation index - a measure of directional synonymous codon usage bias, and its potential applications. Nucleic Acids Res 1987, 15: 1281–1295.
Doolittle WF: Phylogenetic classification and the universal tree. Science 1999, 284: 2124–2129. 10.1126/science.284.5423.2124
Lawrence JG, Ochman H: Molecular archaeology of the Escherichia coli genome. Proc Natl Acad Sci U S A 1998, 95: 9413–9417. 10.1073/pnas.95.16.9413
Ragan MA: On surrogate methods for detecting lateral gene transfer. FEMS Microbiol Lett 2001, 201: 187–191. 10.1016/S0378-1097(01)00262-2
Ragan MA: Detection of lateral gene transfer among microbial genomes. Curr Opin Genet Dev 2001, 11: 620–626. 10.1016/S0959-437X(00)00244-6
Hacker J, Kaper JB: Pathogenicity islands and the evolution of microbes. Annu Rev Microbiol 2000, 54: 641–679. 10.1146/annurev.micro.54.1.641
Kaneko T, Nakamura Y, Sato S, Asamizu E, Kato T, Sasamoto S, Watanabe A, Idesawa K, Ishikawa A, Kawashima K, Kimura T, Kishida Y, Kiyokawa C, Kohara M, Matsumoto M, Matsuno A, Mochizuki Y, Nakayama S, Nakazaki N, Shimpo S, Sugimoto M, Takeuchi C, Yamada M, Tabata S: Complete genome structure of the nitrogen-fixing symbiotic bacterium Mesorhizobium loti. DNA Res 2000, 7: 331–338.
Sandberg R, Winberg G, Bränden CI, Kaske A, Ernberg I, Cöster J: Capturing whole-genome characteristics in short sequences using a naïve Bayesian classifier. Genome Res 2001, 11: 1404–1409. 10.1101/gr.186401
Hooper SD, Berg OG: Detection of genes with atypical nucleotide sequence in microbial genomes. J Mol Evol 2002, 54: 365–375.
Mrázek J, Karlin S: Detecting alien genes in bacterial genomes. Ann N Y Acad Sci 1999, 870: 314–329.
Hori H, Osawa S: Origin and evolution of organisms as deduced from 5S ribosomal RNA sequences. Mol Biol Evol 1987, 4: 445–472.
Lawrence JG, Ochman H: Amelioration of bacterial genomes: rates of change and exchange. J Mol Evol 1997, 44: 383–397.
Kurland CG, Canback B, Berg OG: Horizontal gene transfer: a critical view. Proc Natl Acad Sci U S A 2003, 100: 9658–9662. 10.1073/pnas.1632870100
Ochman H, Elwyn S, Moran NA: Calibrating bacterial evolution. Proc Natl Acad Sci U S A 1999, 96: 12638–12643. 10.1073/pnas.96.22.12638
Garcia-Vallvé S, Romeu A, Palau J: Horizontal gene transfer in bacterial and archaeal complete genomes. Genome Res 2000, 10: 1719–1725. 10.1101/gr.130000
Karlin S: Detecting anomalous gene clusters and pathogenicity islands in diverse bacterial genomes. Trends Microbiol 2001, 9: 335–343. 10.1016/S0966-842X(01)02079-0
Heidelberg JF, Eisen JA, Nelson WC, Clayton RA, Gwinn ML, Dodson RJ, Haft DH, Hickey EK, Peterson JD, Umayam L, Gill SR, Nelson KE, Read TD, Tettelin H, Richardson D, Ermolaeva MD, Vamathevan J, Bass S, Qin H, Dragoi I, Sellers P, McDonald L, Utterback T, Fleishmann RD, Nierman WC, White O: DNA sequence of both chromosomes of the cholera pathogen Vibrio cholerae. Nature 2000, 406: 477–483. 10.1038/35020000
Merkl R: A survey of codon and amino acid frequency bias in microbial genomes focusing on translational efficiency. J Mol Evol 2003, 57: 453–466. 10.1007/s00239-003-2499-1
Ochman H, Lawrence JG, Groisman EA: Lateral gene transfer and the nature of bacterial innovation. Nature 2000, 405: 299–304. 10.1038/35012500
Perrin A, Bonacorsi S, Carbonnelle E, Talibi D, Dessen P, Nassif X, Tinsley C: Comparative genomics identifies the genetic islands that distinguish Neisseria meningitidis, the agent of cerebrospinal meningitis, from other Neisseria species. Infect Immun 2002, 70: 7063–7072. 10.1128/IAI.70.12.7063-7072.2002
Salanoubat M, Genin S, Artiguenave F, Gouzy J, Mangenot S, Arlat M, Billault A, Brottier P, Camus JC, Cattolico L, Chandler M, Choisne N, Claudel-Renard C, Cunnac S, Demange N, Gaspin C, Lavie M, Moisan A, Robert C, Saurin W, Schiex T, Siguier P, Thébault P, Whalen M, Wincker P, Levy M, Weissenbach J, Boucher CA: Genome sequence of the plant pathogen Ralstonia solanacearum. Nature 2002, 415: 497–502. 10.1038/415497a
Nicolas P, Bize L, Muri F, Hoebeke M, Rodolphe F, Ehrlich SD, Prum B, Bessières P: Mining Bacillus subtilis chromosome heterogeneities using hidden Markov models. Nucleic Acids Res 2002, 30: 1418–1426. 10.1093/nar/30.6.1418
da Silva AC, Ferro JA, Reinach FC, Farah CS, Furlan LR, Quaggio RB, Monteiro-Vitorello CB, Van Sluys MA, Almeida NF, Alves LM, do Amaral AM, Bertolini MC, Camargo LE, Camarotte G, Cannavan F, Cardozo J, Chambergo F, Ciapina LP, Cicarelli RM, Coutinho LL, Cursino-Santos JR, El-Dorry H, Faria JB, Ferreira AJ, Ferreira RC, Ferro MI, Formighieri EF, Franco MC, Greggio CC, Gruber A, Katsuyama AM, Kishi LT, Leite RP, Lemos EG, Lemos MV, Locali EC, Machado MA, Madeira AM, Martinez-Rossi NM, Martins EC, Meidanis J, Menck CF, Miyaki CY, Moon DH, Moreira LM, Novo MT, Okura VK, Oliveira MC, Oliveira VR, Pereira HA, Rossi A, Sena JA, Silva C, de Souza RF, Spinola LA, Takita MA, Tamura RE, Teixeira EC, Tezza RI, Trindade dos Santos M, Truffi D, Tsai SM, White FF, Setubal JC, Kitajima JP: Comparison of the genomes of two Xanthomonas pathogens with differing host specificities. Nature 2002, 417: 459–463. 10.1038/417459a
Osawa S, Jukes TH, Watanabe K, Muto A: Recent evidence for evolution of the genetic code. Microbiol Rev 1992, 56: 229–264.
Sandberg R, Bränden CI, Ernberg I, Cöster J: Quantifying the species-specificity in genomic signatures, synonymous codon choice, amino acid usage and G+C content. Gene 2003, 311: 35–42. 10.1016/S0378-1119(03)00581-X
Townsend SM, Kramer NE, Edwards R, Baker S, Hamlin N, Simmonds M, Stevens K, Maloy S, Parkhill J, Dougan G, Bäumler AJ: Salmonella enterica serovar Typhi possesses a unique repertoire of fimbrial gene sequences. Infect Immun 2001, 69: 2894–2901. 10.1128/IAI.69.5.2894-2901.2001
Edwards RA, Olsen GJ, Maloy SR: Comparative genomics of closely related salmonellae. Trends Microbiol 2002, 10: 94–99. 10.1016/S0966-842X(01)02293-4
Ohnishi M, Kurokawa K, Hayashi T: Diversification of Escherichia coli genomes: are bacteriophages the major contributors? Trends Microbiol 2001, 9: 481–485. 10.1016/S0966-842X(01)02173-4
Dziejman M, Balon E, Boyd D, Fraser CM, Heidelberg JF, Mekalanos JJ: Comparative genomic analysis of Vibrio cholerae: genes that correlate with cholera endemic and pandemic disease. Proc Natl Acad Sci U S A 2002, 99: 1556–1561. 10.1073/pnas.042667999
Pagani L, Lang A, Vedovelli C, Moling O, Rimenti G, Pristerà R, Mian P: Soft tissue infection and bacteremia caused by Shewanella putrefaciens. J Clin Microbiol 2003, 41: 2240–2241. 10.1128/JCM.41.5.2240-2241.2003
Rutherford K, Parkhill J, Crook J, Horsnell T, Rice P, Rajandream MA, Barrell B: Artemis: sequence visualization and annotation. Bioinformatics 2000, 16: 944–945. 10.1093/bioinformatics/16.10.944
Wang B: Limitations of compositional approach to identifying horizontally transferred genes. J Mol Evol 2001, 53: 244–250. 10.1007/s002390010214
Koski LB, Morton RA, Golding GB: Codon bias and base composition are poor indicators of horizontally transferred genes. Mol Biol Evol 2001, 18: 404–412.
de la Cruz F, Davies J: Horizontal gene transfer and the origin of species: lessons from bacteria. Trends Microbiol 2000, 8: 128–133. 10.1016/S0966-842X(00)01703-0
Nesbø CL, L'Haridon S, Stetter KO, Doolittle WF: Phylogenetic analyses of two "archaeal" genes in Thermotoga maritima reveal multiple transfers between Archaea and Bacteria. Mol Biol Evol 2001, 18: 362–375.
Olendzenski L, Liu L, Zhaxybayeva O, Murphey R, Shin DG, Gogarten JP: Horizontal transfer of archaeal genes into the deinococcaceae: detection by molecular and computer-based approaches. J Mol Evol 2000, 51: 587–599.
Wolf YI, Aravind L, Grishin NV, Koonin EV: Evolution of aminoacyl-tRNA synthetases-analysis of unique domain architectures and phylogenetic trees reveals a complex history of horizontal gene transfer events. Genome Res 1999, 9: 689–710.
Rocha EP, Danchin A: Base composition bias might result from competition for metabolic resources. Trends Genet 2002, 18: 291–294. 10.1016/S0168-9525(02)02690-2
Daubin V, Lerat E, Perrière G: The source of laterally transferred genes in bacterial genomes. Genome Biol 2003, 4: R57. 10.1186/gb-2003-4-9-r57
Lynn DJ, Singer GA, Hickey DA: Synonymous codon usage is subject to selection in thermophilic bacteria. Nucleic Acids Res 2002, 30: 4272–4277. 10.1093/nar/gkf546
Karlin S, Altschul SF: Methods for assessing the statistical significance of molecular sequence features by using general scoring schemes. Proc Natl Acad Sci U S A 1990, 87: 2264–2268.
Karlin S, Mrazek J: Predicted highly expressed genes of diverse prokaryotic genomes. J Bacteriol 2000, 182: 5238–5250. 10.1128/JB.182.18.5238-5250.2000
Nakamura Y, Gojobori T, Ikemura T: Codon usage tabulated from the international DNA sequence databases; its status 1999. Nucleic Acids Res 1999, 27: 292. 10.1093/nar/27.1.292
Salgado H, Moreno-Hagelsieb G, Smith TF, Collado-Vides J: Operons in Escherichia coli: genomic analyses and predictions. Proc Natl Acad Sci U S A 2000, 97: 6652–6657. 10.1073/pnas.110147297
Altschul SF, Gish W, Miller W, Myers EW, Lipman DJ: Basic local alignment search tool. J Mol Biol 1990, 215: 403–410. 10.1006/jmbi.1990.9999
Acknowledgements
The project was carried out within the framework of the Competence Network Göttingen "Genome research on bacteria" (GenoMik) financed by the German Federal Ministry of Education and Research (BMBF). I thank S. Waack and M. Stanke for discussions concerning statistics and test theory and A. Wiezer and J. Sobkowiak for supplying me with a perfect computational infrastructure.
Author information
Authors and Affiliations
Corresponding author
Authors’ original submitted files for images
Below are the links to the authors’ original submitted files for images.
Rights and permissions
About this article
Cite this article
Merkl, R. SIGI: score-based identification of genomic islands. BMC Bioinformatics 5, 22 (2004). https://doi.org/10.1186/1471-2105-5-22
Received:
Accepted:
Published:
DOI: https://doi.org/10.1186/1471-2105-5-22