- Research article
- Open access
- Published:
Microarray analysis of E9.5 reduced folate carrier (RFC1; Slc19a1) knockout embryos reveals altered expression of genes in the cubilin-megalin multiligand endocytic receptor complex
BMC Genomics volume 9, Article number: 156 (2008)
Abstract
Background
The reduced folate carrier (RFC1) is an integral membrane protein and facilitative anion exchanger that mediates delivery of 5-methyltetrahydrofolate into mammalian cells. Adequate maternal-fetal transport of folate is necessary for normal embryogenesis. Targeted inactivation of the murine RFC1 gene results in post-implantation embryolethality, but daily folic acid supplementation of pregnant dams prolongs survival of homozygous embryos until mid-gestation. At E10.5 RFC1-/- embryos are developmentally delayed relative to wildtype littermates, have multiple malformations, including neural tube defects, and die due to failure of chorioallantoic fusion. The mesoderm is sparse and disorganized, and there is a marked absence of erythrocytes in yolk sac blood islands. The identification of alterations in gene expression and signaling pathways involved in the observed dysmorphology following inactivation of RFC1-mediated folate transport are the focus of this investigation.
Results
Affymetrix microarray analysis of the relative gene expression profiles in whole E9.5 RFC1-/- vs. RFC1+/+ embryos identified 200 known genes that were differentially expressed. Major ontology groups included transcription factors (13.04%), and genes involved in transport functions (ion, lipid, carbohydrate) (11.37%). Genes that code for receptors, ligands and interacting proteins in the cubilin-megalin multiligand endocytic receptor complex accounted for 9.36% of the total, followed closely by several genes involved in hematopoiesis (8.03%). The most highly significant gene network identified by Ingenuity™ Pathway analysis included 12 genes in the cubilin-megalin multiligand endocytic receptor complex. Altered expression of these genes was validated by quantitative RT-PCR, and immunohistochemical analysis demonstrated that megalin protein expression disappeared from the visceral yolk sac of RFC1-/- embryos, while cubilin protein was widely misexpressed.
Conclusion
Inactivation of RFC1 impacts the expression of several ligands and interacting proteins in the cubilin-amnionless-megalin complex that are involved in the maternal-fetal transport of folate and other nutrients, lipids and morphogens such as sonic hedgehog (Shh) and retinoids that play critical roles in normal embryogenesis.
Background
Folate and vitamin B12 are essential vitamins derived from various food sources that play an important role in erythropoiesis, DNA biosynthesis, and embryogenesis. Nutritional deficiencies or genetic variations that impact folate and/or vitamin B12 homeostasis may result in megaloblastic anemia [1], and failure of maternal-fetal transport of these nutrients has been shown to adversely impact normal embryogenesis [2–5]. Folate is a vitamin derived from plant sources that consists of a pteridine ring structure attached to a para-aminobenzoic acid side chain. Tetrahydrofolate, the reduced form of folate, functions as an important co-factor for donating or accepting methyl groups. Adequate levels of folate for the incorporation of single carbon groups into purine, or methylation of deoxyuridylate to form thymidylate, are necessary for DNA biosynthesis. Vitamin B12, also known as cobalamin, is another important vitamin that is obtained from dietary sources such as meat, fish and soybean. Folate and cobalamin metabolism are highly interdependent. In mammals, cobalamin functions as a co-enzyme for methionine synthase, which is involved in the tetrahydrofolate-dependent methylation of homocysteine to methionine [6]. According to the "folate-trap hypothesis", cobalamin deficiency results in 'trapping' of tetrahydrofolate, producing a functional folate deficiency that leads to impaired erythropoiesis and DNA biosynthesis [7].
The primary mechanisms for folate delivery into the cell are through (1) carrier-mediated (reduced folate carrier; RFC1) or (2) receptor-mediated (folate receptor; Folr1) processes. These two transport systems are distinguished by their unique patterns of tissue expression, differing protein structures, specificities for oxidized vs. reduced folates, and divergent mechanisms for transmembrane transport of folates [8]. As mammalian cells are not capable of synthesizing folates de novo, these two transport systems play a critical role in mediating folate uptake for the biosynthesis of purines, pyrimidines, and certain amino acids that are necessary for cell survival and proliferation. It has recently been discovered that megalin, a large multiligand endocytic receptor of the low density lipoprotein receptor family, is capable of binding and mediating uptake of the soluble form of the GPI-anchored folate receptor Folr1, providing yet another pathway for the cellular internalization of folate [9].
The principal route of folate transport into mammalian cells is via the reduced folate carrier (RFC1), a bidirectional transporter characterized by twelve transmembrane domains [8, 10]. RFC1 preferentially transports reduced folates, such as N5-methyltetrahydrofolate or N5-formyltetrahydrofolate, which are anionic at physiological pH. It functions as a facilitative anion exchanger, capable of transporting anionic folates into the cell via a co-transport system in which the uphill transport of folate is coupled to the downhill efflux of organic phosphates or sulfates [8, 11]. Folate uptake into intestinal cells is markedly increased at pH 5.5 relative to pH 7.4 [12, 13], suggesting that RFC1-mediated folate uptake is highly dependent on acidic extracellular pH. In adult tissues, RFC1 expression is observed in the brush border of the small and large intestine, and in the basolateral membrane of renal tubular epithelium, as well as in hepatocytes, choroid plexus, and the retinal pigment epithelium [14]. During development, RFC1 is highly expressed in multiple tissue types, including the placenta and yolk sac, neural tube, craniofacial region, limb buds and heart [14, 15].
We have recently characterized the role of RFC1 during embryonic development in a mouse model in which RFC1 was inactivated by homologous recombination [16]. Without maternal folate supplementation, RFC1-/- embryos die in utero shortly after implantation. RFC1-/- embryos harvested from dams receiving low doses of supplemental folic acid (25 mg/kg/day SQ), survive to mid-gestation (E10.5), but are developmentally delayed, and display multiple malformations, including severe neural tube defects, craniofacial, heart, and limb abnormalities. Examination of the placenta reveals that embryolethality is due to a failure of chorioallantoic fusion. The fetal vasculature appears to form normally, but there is a pronounced absence of erythropoiesis, with very few nucleated fetal red blood cells present in either the fetal blood vessels or the yolk sac blood islands. Maternal folate supplementation with 50 mg/kg/day results in survival to term of 22% of the RFC1 mutants, although the surviving fetuses present with multiple malformations of the craniofacies, lungs, heart and skin.
The reduced folate carrier gene has previously been inactivated in a mouse model [17] through targeted disruption of a large part of exon 3. Zhao [17] reported that the RFC1-/- embryos died in utero before E9.5, but near-normal development could be sustained by supplementing pregnant RFC+/- dams with daily doses of 1 mg folic acid SQ. Approximately 10% of the partially rescued RFC1-/- pups were live-born, but all died within 12 days post-partum. In the Zhao [17]RFC1 knockout mouse model, perinatal lethality was attributed to a marked absence of erythropoiesis in bone marrow, spleen, and liver. Our recent findings indicate that inactivation of RFC1 results in congenital malformations of the heart and lungs that undoubtedly contribute to the failure of RFC1 mutants to survive postnatally.
The purpose of this report is to identify alterations in biochemical and/or molecular genetic pathways that may play a role in the abnormal embryonic morphogenesis observed following inactivation of RFC1. In the current study, the gene expression profiles of whole E9.5 RFC1-/- embryos were compared to that of RFC1+/+ littermates harvested from pregnant dams receiving daily low dose (25 mg/kg/day S.Q.) folate supplementation. Our microarray analysis shows that in the absence of functional RFC1, the expression profiles of numerous transcription factors, as well as several genes involved in hematopoiesis, ion homeostasis, and genes encoding for receptors and/or ligands in the cubilin-megalin multiligand endocytic receptor complex are significantly altered. Follow-up quantitative RT-PCR validation confirms alterations in the expression profiles of several ligands and interacting proteins in the cubilin-megalin complex that are involved in nutrient transport of vitamins and lipids to the developing embryo.
Results
Microarray analysis
In the microarray analysis of E9.5 RFC1-/- embryos vs. RFC1+/+ embryos, the expression patterns of 783 genes were found to be significantly altered at the 0.001 level. However, when looking at the false discovery rate (FDR), only 288 genes (probe sets) were significantly altered at the 0.001 level. Several of the probe sets represent alternate transcripts for the same gene. Taking this into account, 250 unique genes were identified as differentially expressed in the microarray analysis. Of these, 200 represent known genes, while 50 are ESTs or unknowns. The 12 known genes in our data set that have been identified as cell surface receptors, ligands, or interacting proteins in the cubilin-megalin multiligand endocytic receptor complex are listed in Table 1, and the complete set of 200 known genes that were differentially expressed following statistical analysis of the microarray data are also provided [see Additional file 1]. The genes have been categorized according to ontology groups, and the file contains the accession number, gene symbol, gene name, and the mean fold change for the expression level of each gene. The fold-change represents the value for the comparison of level of gene expression in the RFC1-/- embryos relative to the RFC1+/+ embryos. (The data discussed in this publication have also been deposited in NCBIs Gene Expression Omnibus [18] and are accessible to the public through GEO Series accession number GSE10659).
Distribution of gene ontology groups
A pie chart showing the relative distribution (percentage) of the gene ontology groups identified in the microarray analysis of the RFC1-/- vs. RFC1+/+ embryos is shown in Figure 1. The largest ontology group of known genes that was altered included several families of transcription factors (13.04%), followed by genes involved in transport functions (ion, lipid, carbohydrate) (11.37%). Genes that code for receptors, ligands and interacting proteins in the cubilin-megalin multiligand endocytic receptor complex account for 9.36% of the total, followed closely by several genes involved in hematopoiesis (8.03%).

Distribution of gene ontology groups. A pie chart showing the relative distribution (percentage) of the gene ontology groups identified in the microarray analysis of E9.5 RFC1-/- vs. RFC1+/+ embryos is shown. A complete list of the genes within each of these gene ontology groups that were differentially expressed following statistical analysis of the microarray data is provided in [Additional file 1].
Ingenuity Pathway Analysis
The most highly significant gene network identified in the Ingenuity Pathway analysis (Ingenuity™ Systems, Inc., Mountain View, CA) of our Affymetrix microarray data is shown in Figure 2. Based on new information available in the recent literature (interactions not yet reported in the latest release of the Ingenuity Knowledge Base), we identified an additional 11 genes of interest that were placed into this network. These additional genes are represented by 11 custom nodes and edges. In the original "Network 1" of the Ingenuity Pathway Analysis, 32 of the 34 genes that appear were statistically up or down-regulated on our microarray analysis, giving it a score of 55. With the addition of the custom nodes/edges (Folr1, Shh, Timd2, Myo6, Dab2) and nodes from the Cubn neighborhood–(Tf*, LgalS3, Alb, Gif, Amn, Lrp2, Lrpap1*, ScgB1A1) {*genes that already appear in the default "Network 1"} 34 of the 46 genes in the custom network were found to be significant. Many of the key genes highlighted in this top network are members of the ontology group that includes receptors, ligands and interacting proteins found in the cubilin-megalin multiligand endocytic receptor complex. This complex became the focus of further studies due to its important role in the uptake of folate and other vitamins, lipids, and nutrients essential for embryonic development.

Ingenuity™ Pathway gene network. The most highly significant gene network identified in the Ingenuity™ Pathway analysis of our Affymetrix microarray data is shown. An additional 11 'custom' genes were placed into this network based on new information available in the recent literature. Many of the key genes highlighted in this top network are members of the ontology group that includes receptors, ligands and interacting proteins found in the cubilin-megalin multiligand endocytic receptor complex. The networks are displayed graphically as nodes (genes/gene products) and edges (the biological relationships between the nodes). The intensity of the node color indicates the degree of up- (red) or down- (green) regulation in gene expression in our microarray analysis. Nodes are displayed using various shapes that represent the functional class of the gene product. Edges are displayed as a direct interaction (solid line) or as an indirect/unknown interaction (dashed line). The nodes have also been arranged to show the location of the gene/gene product with respect to cellular or subcellular localization (e.g. plasma membrane, cytoplasm, nucleus, etc.).
Cubilin-megalin multiligand endocytic receptor complex
A diagram of the structure of the cubilin-amnionless-megalin multiligand receptor endocytic complex is shown in Figure 3[19]. Megalin and cubilin are two multifunctional endocytic receptors that act in concert in certain tissues to mediate the uptake of a variety of lipoproteins and vitamin-carrier complexes [19–21]. Striking similarities in temporal and spatial expression patterns of megalin and cubilin have been described in mid-late gestation rat embryos [22], although differential patterns of expression have also been reported during early embryonic development in the mouse [23]. Megalin (Lrp2) is a low-density lipoprotein receptor-related protein that is co-expressed with cubilin in many absorptive epithelia, including the neuroepithelium and yolk sac of developing embryos. Several studies indicate a critical role for megalin in normal embryogenesis [24]. Megalin has been shown to bind and internalize multiple ligands, including the soluble folate binding protein (Folr1), and sonic hedgehog (Shh), among others [19, 25–29]. Lack of megalin receptor function in a knockout mouse model results in abnormalities of the kidneys, lungs, central nervous system and craniofacies, and megalin-deficient pups die perinatally within the first few minutes of life due to respiratory insufficiency [30]. Conditional inactivation of megalin in the neuroepithelium has been shown to result in a loss of Shh expression in the ventral telencephalon [31], indicating that megalin-mediated uptake of Shh in the neuroepithelium is critical for early forebrain development [32].
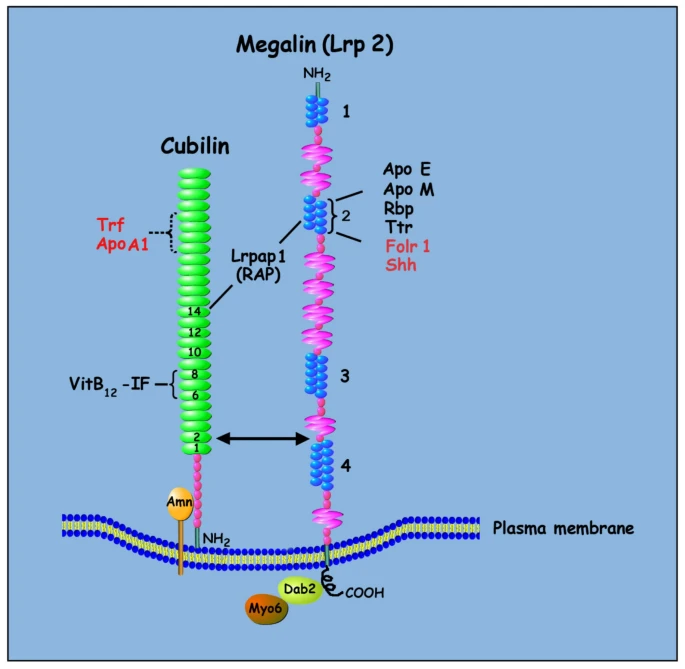
Cubilin-megalin multiligand endocytic receptor complex. A cartoon diagram of the structure of the cubilin-amnionless-megalin multiligand receptor endocytic complex [19] is shown. Megalin is a cell-surface receptor/transporter consisting of a large extracellular region, a single transmembrane domain, and a C-terminal cytoplasmic tail. The extracellular domain of megalin contains four clusters of lipoprotein receptor ligand-binding repeats (blue), growth factor repeats, an EGF repeat, and YWTD spacer regions. The second cluster of ligand-binding repeats has been identified as a common binding site for several ligands including apolipoprotein E (Apo E), apolipoprotein M (Apo M), retinol binding protein (Rbp), and transthyretin (Ttr). Megalin also binds the soluble form of the folate receptor (Folr1), and the morphogen sonic hedgehog (Shh). The cytoplasmic tail of megalin binds Dab2, a cytosolic adapter protein important for megalin-mediated endocytosis, and Dab2 binds and recruits Myo6 to clathrin-coated vesicles. The receptor-associated protein (Lrpap1; RAP) binds both megalin and cubilin. Cubilin is a peripheral membrane receptor comprised of a short amino terminal, eight EGF type domains, and 27 CUB domains (green). The amino-terminal end of cubilin is attached to the extracellular part of amnionless (Amn), and amnionless provides the transmembrane domain necessary for the anchoring and endocytic trafficking of cubilin. Cubilin ligands include transferring (Trf), albumin, hemoglobin, apolipoprotein A1 (ApoA1), and intrinsic factor (IF)-vitamin B12.
Cubilin (gp280) functions as an endocytic receptor for the intrinsic factor-cobalamin complex in the intestine, and as a receptor for apolipoprotein A1 and albumin reabsorption in the kidney proximal tubules and visceral yolk sac [33]. Cubilin is a peripheral membrane receptor comprised of a short amino terminal amphipathic helix, eight EGF type domains, and 27 amino acid modules known as CUB domains [34]. Although cubilin lacks a classic transmembrane domain and cytoplasmic tail, the amino-terminal end is necessary for membrane anchoring [35]. The amino-terminal region of cubilin is attached to the extracellular part of amnionless, which provides the transmembrane domain necessary for anchoring and endocytic trafficking of cubilin [36]. Antibodies directed against cubilin have been reported to have teratogenic effects in rats [37], and targeted disruption of cubilin in a mouse model reveals an essential role for this receptor in embryogenesis [38]. Homozygous inactivation of the murine cubilin gene results in embryolethality between E7.5 – E13.5. Cubilin knockout mice are characterized by defects in certain mesodermally-derived tissues, including failure of somite formation and abnormalities of the yolk sac blood islands and visceral endoderm [38].
A comparative overview of the developmental phenotype of mice with genetically engineered deletions in critical components of the cubilin-megalin multiligand endocytic receptor complex including Cubilin, Amnionless, Megalin, Receptor-Associated Protein (RAP; Lrpap1), and Disabled homolog-2 is provided [see Additional file 2]. The phenotypes of these mutants are compared to the developmental anomalies observed following genetically engineered deletions in the folate transporters Folr1 and RFC1. RFC1-/- embryos on low dose maternal folate supplementation (such as those examined in the microarray analysis) display certain phenotypic traits in common with the more severely affected cubilin, amnionless, and Dab2 knockouts, including failure of chorioallantoic fusion and defects in mesoderm-derived structures, whereas RFC1-/- embryos that survive to term following high dose maternal folate supplementation display a range of malformations more similar to the megalin knockout mutants.
Quantitative real-time PCR validation
Genes in the cubilin-megalin multiligand endocytic receptor complex identified in the Affymetrix microarray analysis, Ingenuity Pathway analysis, or through additional information available in the literature were selected for further expression analysis by quantitative RT-PCR (qRT-PCR). The twelve genes selected for qRT-PCR validation of alterations in gene expression are listed along with a description of their function, and the ABI primer/probe sets used for these experiments [see Additional file 3]. Figure 4 and Table 2 list the results of the qRT-PCR analysis, including p-values, and a graph of the relative levels of expression of the selected genes in the multiligand receptor endocytic complex is shown. Cubn, ApoA1, Amn, Trf, Timd2, Rbp4, Ttr, and the GPI-anchored folate receptor (Folr1) are significantly upregulated in E9.5 RFC1-/- embryos relative to E9.5 RFC1+/+ littermates (*p < .05; **p < .01). However, the qRT-PCR analysis did not detect statistically significant changes in the expression of Lrp2, Lrpap1, Dab2, or Shh. Error bars represent SEM values.

Quantitative RT-PCR relative gene expression levels. The results of the quantitative RT-PCR validation experiments are shown in the graph. Genes were selected for the RT-PCR analysis based on the results of the microarray analysis, or because of their presence in the cubilin-megalin multiligand endocytic receptor complex. The red bars on the left represent the fold change in the expression of cubilin and cubilin-related genes and the blue bars on the right represent the fold change in the expression of megalin and megalin-related genes relative to the expression of the housekeeping genes Ppil2 and Dctn6. (*p < .05; **p < .01) Error bars represent SEM values. Gene symbols, relative expression levels and p values are provided in the corresponding Table 2. Cubilin (Cubn), Apolipoprotein A1 (ApoA1), Amnionless (Amn), Transferrin (Trf), T-cell immunoglobin and mucin domain containing 2 (Timd2), Megalin (Lrp2), Lipoprotein receptor-associated protein 1 (Lrpap1), Disabled (Dab2), Folate Receptor (Folr1), Retinol Binding Protein 4 (Rbp4), Sonic Hedgehog (Shh), Transthyretin (Ttr).
Although neither Folr1 nor megalin gene expression made the cut-off for statistical significance on our microarray analysis, we included them in our qRT-PCR analysis because of their presence in the multiligand endocytic receptor complex, and their important role in nutrient delivery to the developing embryo (Folr1 was upregulated 5.3 fold, p < .0003 on the microarray analysis, but did not make the cut-off for the FDR level). qRT-PCR results demonstrated no significant difference in message levels of megalin between the two groups, but a 10-fold increase in Folr1 expression was detected (p < .017) in RFC1-/-relative to RFC+/+ littermates. RT-PCR validation also demonstrates a highly significant upregulation of cubilin message in RFC1-/- embryos (77-fold, p < .002). Amn mediates cell-surface localization and endocytic function of cubilin in the visceral endoderm [39]. Amn did not make the list of 288 genes identified as statistically significant in our microarray analysis using the stringent cut-off of 0.001 for adjusted p-values (p = .00109). However, due to its critical role in cubilin expression and function, we chose to further analyze amnionless gene expression levels by quantitative RT-PCR. Our results show that, similar to cubilin, the expression of amnionless was highly significantly upregulated (75-fold; p < .002) in RFC1-/- embryos.
Immunohistochemistry
During normal embryonic development, megalin and cubilin are highly expressed in the visceral endoderm (VE) and visceral yolk sac (VYS), and function cooperatively in the maternal-fetal transfer of multiple nutrients and morphogens. The VE is a polarized epithelial tissue that surrounds the developing epiblast. The apical surface of the VE faces maternal tissues, and contains numerous microvilli that function to absorb nutrients from the maternal environment [40]. Additional roles in patterning anterior-posterior polarity of the early embryo, correct positioning of the primitive streak, induction of blood precursors, and forebrain development have been ascribed to the anterior VE [41–43]. Following implantation, the VE surrounding the epiblast differentiates to form the VYS. The VYS continues to play a critical role in maternal-fetal nutrient and waste exchange prior to establishment of the chorioallantoic placenta [44].
Immunohistochemical expression of cubilin, megalin and Folr1 protein in E9.5 RFC1+/+ and RFC1-/- embryos and extra-embryonic membranes was examined. Expression of cubilin, megalin and Folr1 protein in the visceral yolk sac (VYS) is shown in Figure 5. Cubilin (5A), megalin (5C) and Folr1 (5E) protein are all highly expressed on the apical side of the VYS in E9.5 RFC1+/+ embryos (brown staining). Cubilin is also highly expressed on the apical side of the VYS in E9.5 RFC1-/- embryos (5B). Megalin expression, however, is completely absent from the VYS of RFC1 mutants (5D). Folr1 protein expression is absent from the apical plasma membrane of the VYS in RFC1-/- embryos, but demonstrates increased expression in the endothelial cell layer of the yolk sac blood islands (5F).

Cubilin, megalin and Folr1 protein expression in VYS. Expression of cubilin, megalin and Folr1 protein in the visceral yolk sac is shown in Figure 5. Cubilin (A), megalin (C) and Folr1 (E) protein are all highly expressed on the apical side of the visceral yolk sac in E9.5 RFC1+/+ embryos. Cubilin is also highly expressed on the apical side of the visceral yolk sac in E9.5 RFC1-/- embryos (B). Megalin expression, however, is completely absent from the visceral yolk sac of RFC1 mutants (D). Folr1 protein expression is absent from the apical plasma membrane of the VYS, but demonstrates increased expression in the endothelial cell layer of the yolk sac blood islands (F).
Expression of cubilin and megalin protein in the neuroepithelium is shown in Figure 6. Megalin expression is observed in the retinal pigment epithelium, cells lining the otic vesicle, and exclusively on the apical side of neuroepithelial cells (6A; red arrows) in E9.5 RFC1+/+ embryos (brown staining). In RFC1-/- embryos, however, megalin is expressed on both the apical (6B; red arrows) and basolateral side (6B; purple arrowheads) of the neuroepithelium. Positive staining for megalin is also observed in the surface ectoderm, notochord, pericardium, and endothelial cells lining vascular structures (primary head veins/cardinal veins and vitelline vein) of RFC1+/+ embryos, but megalin staining is faint or absent in the (hindbrain) notochord and endothelium of similar vascular structures in RFC1 mutant embryos (not shown). Similar to megalin, cubilin expression is observed in the surface ectoderm (6C; black arrows), retinal pigment epithelium, otic vesicle, and apical side of neuroepithelial cells (6C; 6E; red arrows) in E9.5 RFC1+/+embryos. In RFC1-/- embryos, however, cubilin is misexpressed on the basolateral side of neuroepithelial cells (6D; 6G; purple arrowheads), Discrete, positive staining for cubilin is observed in the notochord of RFC1+/+ embryos (6F, yellow arrow). In contrast, the expression of cubilin protein appears to be highly upregulated and widespread throughout the (sparse) mesenchyme underlying the neural tube (NT) of RFC1-/- embryos, especially in the region surrounding the notochord (6D, 6H, yellow arrow). Cubilin staining is present in the pericardium of both RFC1 wildtype (6I; black arrowhead) and mutant embryos. Although there are a few cells that stain positive for cubilin in the trabeculae of the common ventricular chamber in the RFC1 wildtype heart, cubilin expression is dramatically upregulated throughout the myocardium of the developing heart in RFC1 mutants (6J).

Cubilin and megalin protein expression in E9.5 embryos. Immunohistochemical staining was performed on transverse sections through E9.5 RFC1+/+ and RFC1-/- embryos in order to examine the relative expression and distribution of megalin and cubilin protein. The level and plane of the sections shown in Figure 6 is illustrated by the line drawn through the embryo shown in the upper left hand corner. The red boxes drawn over the neuroepithelium of embryos shown in 6C and 6D (4× magnification) indicate the orientation of the higher magnification panels (40× magnification) shown in 6A, 6B, 6E, and 6G; the apical surface (ventricular side) of the neuroepithelial cells is shown on the right of these panels, and the basolateral, or mesenchymal side of the neuroepithelial cells is shown on the left side of the panels. Megalin is expressed exclusively on the apical side of neuroepithelial cells in RFC1 wildtype embryos (6A; red arrows), but is expressed on both the apical (6B; red arrows) and the basolateral side (6B; purple arrowheads) of the neuroepithelium in RFC1 mutants. Cubilin expression is also restricted to the apical side of neuroepithelial cells in RFC1 wildtype embryos (6C, 6E; red arrows), but is misexpressed on the basolateral side of the neuroepithelium in RFC1 nullizygous embryos (6D, 6G; purple arrowheads). Staining for cubilin protein is visible in the surface ectoderm of RFC1+/+ embryos (6C; black arrows), and discrete staining is also observed in the notochord (6C, 6F; yellow arrow). Cubilin expression is highly upregulated in the cranial mesenchyme of RFC1-/- embryos (shown in panel 6D) relative to wildtype littermates, especially in the region surrounding the notochord (6H; yellow arrow). Staining for cubilin protein is visible in the mesothelial cells of the pericardium of RFC1 wildtype (6I; black arrowhead) and RFC1 mutant embryos (not visible in section shown in 6J), and although there are a few cells that stain positive for cubilin in the trabeculae of the common ventricular chamber in the wildtype embryo, cubilin expression is dramatically upregulated throughout the myocardium of the RFC1 mutant (6J). Normal morphology of the primary head vein/cephalic extension of the anterior cardinal vein (**) and the third branchial arch artery (*) in the RFC1 wildtype embryo are shown in (6C); comparable structures labeled in the RFC1 mutant (6D) indicate abnormal vascular morphology. LV: left ventricle.
Discussion
In the present study, microarray analysis of gene expression in whole E9.5 RFC1-/- embryos vs. RFC1+/+ littermates was utilized as a tool for discovering genetic pathways disrupted in the absence of RFC1 that may play a role in the observed developmental anomalies. Our results indicate that RFC1-/- embryos have alterations in the expression of several genes that code for receptors, ligands, interacting proteins, and modifiers of the cubilin-megalin multiligand endocytic receptor complex. Cubilin and megalin are both expressed in the VYS and play a critical role in the maternal-fetal transport of multiple ligands. In the VYS, blood vessels develop adjacent to the VE cell layer, and cell-cell interactions between yolk sac mesenchyme and VE appear to be important for vascular development [45, 46]. Cubilin and megalin are cell surface proteins expressed in the extraembryonic VE that work cooperatively to mediate endocytosis of lipoproteins and vitamin complexes (including folate and intrinsic factor-vitamin B12) necessary for erythropoiesis and embryonic development. Uptake of folate and nutrients by the VE may therefore play a role in development of the adjacent yolk sac mesenchyme necessary for formation of the allantois and the initiation of erythropoiesis. In the absence of RFC1, the primary route of folate uptake into cells may be the GPI-anchored folate receptor, or internalization of folate bound to the soluble form of the folate receptor via endocytosis by megalin [28].
Although our RT-PCR results demonstrated no significant difference in message levels of megalin, a 10-fold increase in Folr1 expression was detected in RFC1-/- relative to RFC+/+ littermates. IHC examination of megalin and Folr1 protein expression in RFC1-/- embryos indicates the disappearance of megalin on the apical cell surface of the VYS, as well as aberrant expression of Folr1, suggesting that, in addition to the absence of RFC1-mediated folate transport, folate uptake via the Folr1-megalin transport pathway may also be compromised in the VYS of RFC1-/- embryos.
Microarray analysis and RT-PCR validation demonstrated highly significant upregulation of cubilin message in E9.5 RFC1-/- embryos. Follow-up IHC analysis suggested a corresponding upregulation in cubilin protein, although technical challenges associated with extracting sufficient amounts of protein from the tiny E9.5 mutant embryos precluded western blot quantification. In RFC1+/+, cubilin protein is observed on the apical surface of neuroepithelial cells, while in mutant embryos, cubilin protein is observed predominantly on the basolateral side of the neuroepithelium. Increased expression of cubilin protein is also widely visible throughout the heart and cranial mesenchyme in RFC1-/- embryos, and is particularly evident in the region surrounding the notochord. It is of interest to note that staining for cubilin remains high on the apical plasma membrane of the VYS in RFC1 mutants, and the polarity of expression does not seem to be altered as it does in the neuroepithelium.
Previous reports suggest that cubilin-mediated endocytosis requires the presence of megalin [47]. If this is the case, even though cubilin is highly expressed in the VYS of RFC1-/- embryos, cubilin-mediated internalization of nutrients in the VYS may be impaired in the absence of megalin, resulting in the observed accumulation of cubilin on the apical surface of the plasma membrane. Defective endocytosis of the cubilin-megalin complex and the observed upregulation in gene expression of transferrin, transthyretin, retinol binding protein, and several of the apolipoproteins in RFC1-/- embryos may reflect a compensatory upregulation in genes encoding for these cubilin-megalin transported ligands, secondary to a perceived deficiency in these nutrients by the developing embryo.
The expression of amn was also significantly upregulated in RFC1-/- embryos.Amn is expressed in the VE, and forms a tight complex with the N-terminal end of cubilin, providing the transmembrane domain necessary for membrane anchoring and endocytic trafficking of cubilin. Amn is therefore an essential component of the cubilin receptor complex, facilitating the endocytosis/transcytosis of cubilin-bound ligands and nutrients that are absorbed from the maternal environment and transported to the developing embryo during gastrulation. Similar to the RFC1-/-, embryonic development is arrested during gastrulation in amn mouse mutants [48–50]. Amn knockout embryos appear abnormal during the early primitive streak stage (E6.5–7.0), and then die between E9.5–E10.5. Mutant embryos are smaller than wildtype littermates, and the embryonic ectoderm is underdeveloped [48]. Depending on the genetic background of the amn mouse mutant, the amniotic membrane may be present [49] or absent [48]. Extra-embryonic structures derived from proximal streak mesoderm (chorion, allantois, yolk sac blood islands), and distal streak mesoderm (notochord, foregut, cardiac mesoderm) in amn mutants appear to develop normally, but embryos have impaired assembly of derivatives of the middle primitive streak, resulting in the absence of paraxial, intermediate and lateral plate mesoderm.
Dab2
gene expression was upregulated in our microarray analysis of RFC1-/- embryos, but the difference was not statistically significant on RT-PCR analysis. Dab2 is a cytosolic adapter protein expressed in the VE and VYS. Inactivation of murine Dab2 results in disorganization of the VE layer, and early embryonic lethality prior to gastrulation [51]. Embryos appear to develop normally when Dab2 is conditionally deleted from only the embryo, indicating that Dab2 expression in the VE is the essential component for progression of normal embryogenesis [52]. Dab2 binds to a common sequence in the cytoplasmic tails of lipoprotein receptors [53], and has been found in complexes with megalin in the kidney [54, 55], suggesting it may be involved in mediating the intracellular trafficking and/or endocytosis of megalin. The Dab2 gene is alternatively spliced to produce two protein products [56]; expression of the p96 isoform is essential for normal embryonic development and endocytosis of megalin in the VE [57, 58]. In p96 Dab2 mutants, megalin and cubilin accumulate at the apical plasma membrane surface, and little intracellular protein or co-localization with early endosome markers is observed. However, if the p67 isoform of Dab2 is inactivated, approximately 50% of homozygotes die by E10.5, and surviving mutants are small and developmentally delayed relative to wildtype littermates [58]. Altered expression of Myo6 was also detected in our microarray analysis of RFC1-/- embryos. Both isoforms of Dab2 bind and recruit Myo6 to clathrin-coated vesicles [52, 59], and function in clathrin-mediated endocytosis in polarized epithelial cells [60–62].
Receptor-associated protein (RAP or Lrpap1)
is another component of the cubilin-megalin multiligand endocytic receptor complex that demonstrated increased expression in RFC1-/- embryos on our microarray analysis, but did not show a statistically significant difference in the RT-PCR analysis. RAP binds both megalin [63] and cubilin [35], and functions as a chaperone-like protein to promote proper folding and protect the ligand binding sites of newly processed low density lipoprotein receptor family proteins, preventing premature interaction of ligands with the receptors [64, 65]. Megalin binds to two separate sites on RAP [66] with high affinity, and the binding is calcium-dependent. RAP resides predominantly in the endoplasmic reticulum where it binds and escorts megalin receptors to the golgi. Dissociation of the complex occurs in late endosomes, triggered by the acidic pH of this compartment, and the subsequent protonation of exposed histidine residues on the surface of RAP that modulate the binding/release of RAP from megalin [67]. RAP is subsequently delivered to lysosomes and degraded, while megalin is recycled to the cell surface [68]. RAP deficiency is associated with a decrease in megalin expression and a change in subcellular distribution, causing an accumulation of megalin in intracellular compartments. Homozygous RAP-deficient mice are viable and appear phenotypically normal, although megalin expression in the liver and brain is significantly reduced [69].
In the renal brush border, megalin has been shown to specifically bind NHE3 [70], a Na+/H+ ion exchanger that mediates the electroneutral exchange of intracellular H+ for extracellular Na+ across plasma membranes. NHE3 plays a critical role in NaCl homeostasis, and the maintenance of intracellular pH, and has also been shown to play a role in clathrin-mediated endocytosis and endosomal acidification [71]. In renal proximal tubule cells, NHE3 deficiency or inhibition reduces the relative cell surface expression of megalin, suggesting intracellular retention of megalin due to impaired trafficking/recycling of endosomes back to the plasma membrane [71]. On our microarray analysis, the gene expression profile of numerous ion channels was altered in RFC1-/-embryos (see supplemental data). RFC1 functions not only in the cellular uptake of folate, but also as a facilitative anion exchanger, and its deletion may impact intracellular pH homeostasis. The association of RAP with megalin is highly pH dependent. Premature dissociation of the RAP-megalin complex could result in misfolding, or early intracellular degradation of megalin along the secretory pathway, which might provide an alternative explanation for the disappearance of megalin protein on the surface of the VYS and neuroepithelium in RFC1 mutants. The absence of cell surface expression of megalin would impact uptake of megalin binding ligands such as transthyretin, hemoglobin, retinol binding protein, apolipoproteins, and shh, and might also impact megalin-dependent endocytosis of the cubilin-binding ligands such as albumin, transferrin, and apolipoprotein A-I. This would result in not only in a folate deficiency, but would also significantly impact maternal-fetal delivery of numerous other nutrients and morphogens required for normal vasculogenesis, hematopoiesis and embryonic development.
Conclusion
RFC1 functions as a facilitative anion exchanger and the primary transporter of reduced folates in multiple tissue types. Polymorphisms in folate transport genes have been implicated as risk factors for certain types of birth defects, and recent evidence from human epidemiological studies demonstrates an association between polymorphisms in RFC1 and increased risk for neural tube defects [72–74], and conotruncal heart defects [75, 76]. However, the mechanism(s) by which altered RFC1-mediated folate transport perturb normal morphogenesis are currently unknown. In our knockout mouse model, loss of functional RFC1 during embryogenesis alters the gene expression of numerous transcription factors and ion channels, as well as the expression of a group of genes that code for receptors, ligands and interacting proteins in the cubilin-megalin multiligand endocytic receptor complex. Alterations in the quantity and location of cubilin and megalin protein expression are observed in the yolk sac, neuroepithelium, and mesoderm of E9.5 RFC1 nullizygous mutants. Inactivation of cubilin, amnionless, or dab2 impacts early development, resulting in disorganization of the visceral endoderm, as well as deficiencies in the formation of mesodermal structures, including the chorioallantois, blood islands, and primitive erythrocytes, similar to the phenotype observed in RFC1-/- mutants on low dose maternal folate [see Additional file 2]. Inactivation of lrp2 (megalin) results in multiple malformations later in embryonic/fetal development that include neuroepithelial defects, and craniofacial and lung dysmorphologies similar to those observed in RFC1-/- mutants on high dose maternal folate [see Additional file 2]. The spectrum of malformations observed in RFC1 knockout embryos may therefore be causally related to altered expression of the cubilin-amnionless-megalin complex which mediates the maternal-fetal transport of folate and other nutrients, lipids, and morphogens such as sonic hedgehog (Shh) and retinoids that play critical roles in normal embryogenesis.
Methods
Experimental animals
RFC1 knockout mice were generated by targeted inactivation of the RFC1 (Slc19a1) allele as previously described [77]. Following identification of germline chimeras, the mutation was transferred from the hybrid stock genetic background (C57BL/6J) onto an inbred SWV genetic background. RFC/SWV heterozygous mice were housed in microisolator cages, maintained on a 12-hour light/dark cycle, and allowed access to normal Harlan-Teklad (Madison, WI) rodent chow [#8604] and autoclaved water in the AAALAC-accredited University of Nebraska Medical Center (UNMC) laboratory animal facility. All animal procedures were done in accordance with the Public Health Service (PHS) policy on Humane Care and Use of Laboratory Animals, and approved by the UNMC Institutional Animal Care and Use committee. Virgin females 50–70 days of age were mated to males between the hours of 5–10 PM each evening. Females exhibiting vaginal plugs at the end of this period were weighed and housed, up to 5 females per cage, and subsequently placed in treatment groups. The time of conception was considered to be 10 PM on the evening of the mating.
Folate supplementation
Folic acid was purchased from Sigma Chemical Co. (St. Louis, MO), and dissolved in nanopure water to make a solution of the desired concentration. Pregnant dams received folic acid (25 mg/kg) by subcutaneous (S.Q.) injection (0.1 ml/10 gm bwt), beginning on E0.5, and continuing daily throughout gestation until the time of sacrifice.
Fetal collection and morphological staging
At the desired gestational timepoint (E9.5), pregnant RFC1+/- dams were killed by cervical dislocation, the abdomen opened, and the uterine contents removed. The location of all viable fetuses and resorption sites were recorded. Embryos/fetuses were dissected free of the decidual capsule, including its chorion and amnion, and examined for the presence of gross abnormalities. Extraembryonic membranes were collected for genotyping. Whole fetuses were viewed under a Nikon SMZ 1500 stereomicroscope, and photographed using an Optronics® (Goleta, CA) camera.
Tissue preparation
Three separate litters were collected, and one RFC1+/+ and one RFC1-/- embryo from each litter were selected for the microarray experiment. Pregnant dams were sacrificed, and E9.5 RFC1 embryos were quickly removed from the uterus, placed in RNase-free PBS on ice, weighed, snap frozen and stored at -80°C until RNA extraction was performed. Extraembryonic membranes were collected for genotyping. Following confirmation of genotype, total RNA was extracted from the embryonic tissue, and provided to the UNMC microarray core facility for further processing.
RNA isolation
Total RNA from each whole E9.5 embryo was isolated using the Arcturus (Mountain View, CA) PicoPure kit with an on-column DNAse treatment following a 30 second homogenization using a Kontes Pellet Pestle. Yields of 1.7–39.6 μg of total RNA were obtained, quantitated, and checked on a NanoChip using a 2100 Bioanalyzer (Agilent Technologies, Palo Alto, CA) in order to determine sample integrity prior to microarray analysis or QRT-PCR. All RNAs were stored at -80°C until downstream analysis was performed. For the microarray experiment, total RNA was reverse-transcribed, and biotin-labeled cRNA probe generated.
Microarray experiment
100 ng of total RNA was reverse-transcribed and cRNA generated per Affymetrix instructions using the Affymetrix 2-cycle Target Labeling Kit. Resultant cRNA probes were hybridized to the Affymetrix (Santa Clara, CA) Mouse 430 2.0 genome chip, which profiles the expression of 45,101 unique transcripts. Following washing and staining, the chips were scanned using a GeneChip Scanner 3,000 6 G in the UNMC microarray core facility. Images were analyzed using GCOS imaging software. Quality metric parameters including noise level, background, and the efficiency of reverse transcription were ascertained for all hybridizations. Data sets passing the stringent quality recommendations were normalized using the GCOS software, and the raw intensity values exported for further analysis.
Statistical analysis
Microarray data processing
Analyses were conducted with BRB ArrayTools developed by Dr. Richard Simon and Amy Peng. Low-level analysis which converts probe level data to a gene level expression data was done using robust multiarray average (RMA), implemented using the rma function of the Affymetrix package of the Bioconductor project in the R programming language [78–80]. The RMA background correction method corrects the perfect match (PM) probe intensities by using a model based on the assumption that the observed intensities are the sum of signal and noise. Quantile normalization was used to normalize the PM probes and the calculation of summary expression measures was done using the median polish method, which fits a multichip linear model to the data, and gives the expression on the log2 scale. Prior to statistical analysis a filter was applied to reduce the number of genes examined. A gene was excluded unless at least 1 out of the 6 arrays had expression data with a 1.5-fold change or greater in either direction from the gene's median value. This filter reduced the number of transcripts examined to 2982.
Differential expression
The mice were paired as litter-mates (one wildtype and one nullizygous embryo from each litter) and for each gene, a random-variance paired t-test was conducted to determine if there was a significant difference in expression between the mutant and wild type groups for that gene [81]. P-value adjustment for multiple comparisons was done with the false discovery rate (FDR) method of Benjamini-Hochberg [82]. A significance level of 0.001 for the adjusted univariate test was used to select differentially expressed genes. This reduced the number of probe sets examined to 288.
Quantitative real-time PCR (qRT-PCR) validation
First-strand cDNA synthesis
The SuperScript™ III First-strand Synthesis System for RT-PCR (Invitrogen, Carlsbad, CA) was used to synthesize first-strand cDNA from total RNA. cDNAs were synthesized starting with 300 ng of sample RNAs or 1000 ng of Mouse Universal RNA (MUR, Stratagene, La Jolla, CA) using oligo(dT) primer according to kit directions. cDNAs were stored at -20°C. Prior to QRTPCR all cDNAs were diluted with nuclease-free water to 10 ng/ul (based on the amount of input RNA).
Quantitative RT-PCR
Quantitative RT-PCR was performed using the Stratagene MX3000P with MxPro v 3.00 software for Comparative Quantitation (Stratagene, La Jolla, CA). The 20 μl reaction consisted of 10 μl 2X TaqMan Universal Master Mix with AmpErase UNG (Applied Biosystems, Foster City, CA), 1 μl of 20X Target Mix [mouse gene-specific primers (forward and reverse), 900 nM final concentration; mouse gene-specific 6-FAM-labeled TaqMan MGB probe at 250 nM final concentration] (Applied Biosystems, Foster City, CA), 1 μl of cDNA, 8 μl nuclease-free water (Ambion, Austin, TX). Controls included no-template controls and "Minus reverse transcriptase" controls. All samples were run in triplicate. Two target genes were used for data normalization: Dctn6 (Dynactin 6) and PPIL2 (peptidylprolyl (cyclophilin)-like isomerase 2). See [Additional file 3] for Genes of Interest (GOI) used in the experiments. A calibrator template, Mouse Universal RNA (from mouse tissues, Stratagene, La Jolla, CA) was also used throughout the course of the assays.
Statistical analysis of quantitative RT-PCR data
Amplification efficiency curves were generated for each primer/probe set and for each round of cDNA synthesis using 4-fold serial dilutions of mouse universal RNA (Stratagene, La Jolla, CA). Ct values were determined using the MxPro software (Stratagene, La Jolla, CA). Relative levels of mRNA expression in RFC1 nullizygous and wildtype embryos were calculated using the Relative Expression Software Tool (REST v1.9.12) [83]. This software provides proper error propagation and robust statistical analysis by using a random reallocation algorithm with 50,000 iterations. Normalization for each experimental sample used the geometric means of the relative concentration of each normalizer gene (Dctn6 and PPIL 2) [84].
Ingenuity™ Pathway Analysis
The list of significantly altered genes identified in the microarray analysis was also examined for the presence of interacting gene networks using Ingenuity™ Pathway Analysis software. A data set containing gene identifiers and their corresponding expression values was uploaded as an Excel spreadsheet using the template provided in the application. Each gene identifier was mapped to its corresponding gene object in the Ingenuity Pathways Knowledge Base. For our data set, the Affymetrix probe set ID was used as an identifier, and an expression value cutoff of 1.5 was set to identify genes whose expression was significantly differentially regulated. These genes were then used as the starting point for generating biological networks. Biological functions were assigned to each gene network by using the findings that have been extracted from the scientific literature and stored in the Ingenuity Pathways Knowledge Base. The biological functions assigned to each network are ranked according to the significance of that biological function to the network. A Fischer's exact test was used to calculate a p-value determining the probability that the biological function assigned to that network is explained by chance alone.
Immunohistochemistry
The distribution and abundance of cubilin and megalin were characterized immunohistochemically in placentas and embryos collected from control and folic-acid treated dams. Pregnant females were euthanized on E9.5, embryos collected, fixed in fresh 4% paraformaldehyde, paraffin-embedded, and sectioned at 10 μm. Primary antibodies to cubilin and megalin, and FOLR1 were purchased from Santa Cruz Inc., (Santa Cruz, CA). Primary antibody dilutions were optimized at cubilin (1:100), megalin (1:200), and FOLR1 (1:300). Sections were incubated with biotin-conjugated secondary antibody (light microscopy), followed by incubation with streptavidin-HRP, and diaminobenzidine (DAB) solution until brown staining was visible, and counterstained with methyl green. Sections were viewed under a Nikon Eclipse E800 microscope, photographed using an Optronics® (Goleta, CA) camera and AnalySIS® (Soft Imaging Systems Corp., Lakewood, CA) software, and images processed in Adobe Photoshop.
Abbreviations
- VYS :
-
visceral yolk sac
- NHE3 :
-
Na+/H+ ion exchanger
- RMA :
-
robust multiarray average
- FDR :
-
false discovery rate
- REST :
-
Relative Expression Software Tool
- DAB :
-
diaminobenzidine
- HRP :
-
horseradish peroxidase.
References
Wickramasinghe SN: Diagnosis of megaloblastic anaemias. Blood Rev. 2006, 20 (6): 299-318. 10.1016/j.blre.2006.02.002.
Piedrahita JA, Oetama B, Bennett GD, van Waes J, Kamen BA, Richardson J, Lacey SW, Anderson RG, Finnell RH: Mice lacking the folic acid-binding protein Folbp1 are defective in early embryonic development. Nat Genet. 1999, 23 (2): 228-232. 10.1038/13861.
Tang LS, Finnell RH: Neural and orofacial defects in Folp1 knockout mice [corrected]. Birth Defects Res A Clin Mol Teratol. 2003, 67 (4): 209-218. 10.1002/bdra.10045.
Tang LS, Wlodarczyk BJ, Santillano DR, Miranda RC, Finnell RH: Developmental consequences of abnormal folate transport during murine heart morphogenesis. Birth Defects Res Part A Clin Mol Teratol. 2004, 70 (7): 449-458. 10.1002/bdra.20043.
Spiegelstein O, Mitchell LE, Merriweather MY, Wicker NJ, Zhang Q, Lammer EJ, Finnell RH: Embryonic development of folate binding protein-1 (Folbp1) knockout mice: Effects of the chemical form, dose, and timing of maternal folate supplementation. Dev Dyn. 2004, 231 (1): 221-231. 10.1002/dvdy.20107.
Stipanuk MH: Sulfur amino acid metabolism: pathways for production and removal of homocysteine and cysteine. Annu Rev Nutr. 2004, 24: 539-577. 10.1146/annurev.nutr.24.012003.132418.
Shane B, Stokstad EL: Vitamin B12-folate interrelationships. Annu Rev Nutr. 1985, 5: 115-141. 10.1146/annurev.nu.05.070185.000555.
Matherly LH, Goldman DI: Membrane transport of folates. Vitam Horm. 2003, 66: 403-456.
Birn H: The kidney in vitamin B12 and folate homeostasis: characterization of receptors for tubular uptake of vitamins and carrier proteins. Am J Physiol Renal Physiol. 2006, 291 (1): F22-36. 10.1152/ajprenal.00385.2005.
Sirotnak FM, Tolner B: Carrier-mediated membrane transport of folates in mammalian cells. Annu Rev Nutr. 1999, 19: 91-122. 10.1146/annurev.nutr.19.1.91.
Yang CH, Sirotnak FM, Dembo M: Interaction between anions and the reduced folate/methotrexate transport system in L1210 cell plasma membrane vesicles: directional symmetry and anion specificity for differential mobility of loaded and unloaded carrier. J Membr Biol. 1984, 79 (3): 285-292. 10.1007/BF01871067.
Schron CM, Washington C, Blitzer BL: The transmembrane pH gradient drives uphill folate transport in rabbit jejunum. Direct evidence for folate/hydroxyl exchange in brush border membrane vesicles. J Clin Invest. 1985, 76 (5): 2030-2033. 10.1172/JCI112205.
Balamurugan K, Said HM: Role of reduced folate carrier in intestinal folate uptake. Am J Physiol Cell Physiol. 2006, 291 (1): C189-93. 10.1152/ajpcell.00594.2005.
Maddox DM, Manlapat A, Roon P, Prasad P, Ganapathy V, Smith SB: Reduced-folate carrier (RFC) is expressed in placenta and yolk sac, as well as in cells of the developing forebrain, hindbrain, neural tube, craniofacial region, eye, limb buds and heart. BMC Dev Biol. 2003, 3: 6-10.1186/1471-213X-3-6.
Wang Y, Zhao R, Russell RG, Goldman ID: Localization of the murine reduced folate carrier as assessed by immunohistochemical analysis. Biochim Biophys Acta. 2001, 1513 (1): 49-54. 10.1016/S0005-2736(01)00340-6.
Gelineau-van Waes J, Heller S, Aleman F, Maddox JR, Bauer LK, Wilberding J, Rosenquist TH, Finnell RH: Embryonic Development in the Reduced Folate Carrier Knockout Mouse Is Modulated by Maternal Folate Supplementation. Birth Defects Res A Clin Mol Teratol. 2008,
Zhao R, Russell RG, Wang Y, Liu L, Gao F, Kneitz B, Edelmann W, Goldman ID: Rescue of embryonic lethality in reduced folate carrier-deficient mice by maternal folic acid supplementation reveals early neonatal failure of hematopoietic organs. J Biol Chem. 2001, 276 (13): 10224-10228.
National Center for Biotechnology Information: National Center for Biotechnology Information. Data series GSE10659. Gene Expression Omnibus,.
Christensen EI, Birn H: Megalin and cubilin: multifunctional endocytic receptors. Nat Rev Mol Cell Biol. 2002, 3 (4): 256-266.
Moestrup SK, Verroust PJ: Megalin- and cubilin-mediated endocytosis of protein-bound vitamins, lipids, and hormones in polarized epithelia. Annu Rev Nutr. 2001, 21: 407-428. 10.1146/annurev.nutr.21.1.407.
Moestrup SK: New insights into carrier binding and epithelial uptake of the erythropoietic nutrients cobalamin and folate. Curr Opin Hematol. 2006, 13 (3): 119-123. 10.1097/01.moh.0000219654.65538.5b.
Assemat E, Chatelet F, Chandellier J, Commo F, Cases O, Verroust P, Kozyraki R: Overlapping expression patterns of the multiligand endocytic receptors cubilin and megalin in the CNS, sensory organs and developing epithelia of the rodent embryo. Gene Expr Patterns. 2005, 6 (1): 69-78. 10.1016/j.modgep.2005.04.014.
Drake CJ, Fleming PA, Larue AC, Barth JL, Chintalapudi MR, Argraves WS: Differential distribution of cubilin and megalin expression in the mouse embryo. Anat Rec A Discov Mol Cell Evol Biol. 2004, 277 (1): 163-170. 10.1002/ar.a.10123.
Fisher CE, Howie SE: The role of megalin (LRP-2/Gp330) during development. Dev Biol. 2006, 296 (2): 279-297. 10.1016/j.ydbio.2006.06.007.
Moestrup SK, Birn H, Fischer PB, Petersen CM, Verroust PJ, Sim RB, Christensen EI, Nexo E: Megalin-mediated endocytosis of transcobalamin-vitamin-B12 complexes suggests a role of the receptor in vitamin-B12 homeostasis. Proc Natl Acad Sci U S A. 1996, 93 (16): 8612-8617. 10.1073/pnas.93.16.8612.
Barth JL, Argraves WS: Cubilin and megalin: partners in lipoprotein and vitamin metabolism. Trends Cardiovasc Med. 2001, 11 (1): 26-31. 10.1016/S1050-1738(01)00080-9.
Birn H, Willnow TE, Nielsen R, Norden AG, Bonsch C, Moestrup SK, Nexo E, Christensen EI: Megalin is essential for renal proximal tubule reabsorption and accumulation of transcobalamin-B(12). Am J Physiol Renal Physiol. 2002, 282 (3): F408-16.
Birn H, Zhai X, Holm J, Hansen SI, Jacobsen C, Christensen EI, Moestrup SK: Megalin binds and mediates cellular internalization of folate binding protein. Febs J. 2005, 272 (17): 4423-4430. 10.1111/j.1742-4658.2005.04857.x.
Morales CR, Zeng J, El Alfy M, Barth JL, Chintalapudi MR, McCarthy RA, Incardona JP, Argraves WS: Epithelial Trafficking of Sonic Hedgehog by Megalin. J Histochem Cytochem. 2006
Willnow TE, Hilpert J, Armstrong SA, Rohlmann A, Hammer RE, Burns DK, Herz J: Defective forebrain development in mice lacking gp330/megalin. Proc Natl Acad Sci U S A. 1996, 93 (16): 8460-8464. 10.1073/pnas.93.16.8460.
Spoelgen R, Hammes A, Anzenberger U, Zechner D, Andersen OM, Jerchow B, Willnow TE: LRP2/megalin is required for patterning of the ventral telencephalon. Development. 2005, 132 (2): 405-414. 10.1242/dev.01580.
McCarthy RA, Barth JL, Chintalapudi MR, Knaak C, Argraves WS: Megalin functions as an endocytic sonic hedgehog receptor. J Biol Chem. 2002, 277 (28): 25660-25667. 10.1074/jbc.M201933200.
Assemat E, Vinot S, Gofflot F, Linsel-Nitschke P, Illien F, Chatelet F, Verroust P, Louvet-Vallee S, Rinninger F, Kozyraki R: Expression and role of cubilin in the internalization of nutrients during the peri-implantation development of the rodent embryo. Biol Reprod. 2005, 72 (5): 1079-1086. 10.1095/biolreprod.104.036913.
Moestrup SK, Kozyraki R, Kristiansen M, Kaysen JH, Rasmussen HH, Brault D, Pontillon F, Goda FO, Christensen EI, Hammond TG, Verroust PJ: The intrinsic factor-vitamin B12 receptor and target of teratogenic antibodies is a megalin-binding peripheral membrane protein with homology to developmental proteins. J Biol Chem. 1998, 273 (9): 5235-5242. 10.1074/jbc.273.9.5235.
Kristiansen M, Kozyraki R, Jacobsen C, Nexo E, Verroust PJ, Moestrup SK: Molecular dissection of the intrinsic factor-vitamin B12 receptor, cubilin, discloses regions important for membrane association and ligand binding. J Biol Chem. 1999, 274 (29): 20540-20544. 10.1074/jbc.274.29.20540.
Fyfe JC, Madsen M, Hojrup P, Christensen EI, Tanner SM, de la Chapelle A, He Q, Moestrup SK: The functional cobalamin (vitamin B12)-intrinsic factor receptor is a novel complex of cubilin and amnionless. Blood. 2004, 103 (5): 1573-1579. 10.1182/blood-2003-08-2852.
Sahali D, Mulliez N, Chatelet F, Dupuis R, Ronco P, Verroust P: Characterization of a 280-kD protein restricted to the coated pits of the renal brush border and the epithelial cells of the yolk sac. Teratogenic effect of the specific monoclonal antibodies. J Exp Med. 1988, 167 (1): 213-218. 10.1084/jem.167.1.213.
Smith BT, Mussell JC, Fleming PA, Barth JL, Spyropoulos DD, Cooley MA, Drake CJ, Argraves WS: Targeted disruption of cubilin reveals essential developmental roles in the structure and function of endoderm and in somite formation. BMC Dev Biol. 2006, 6: 30-10.1186/1471-213X-6-30.
Strope S, Rivi R, Metzger T, Manova K, Lacy E: Mouse amnionless, which is required for primitive streak assembly, mediates cell-surface localization and endocytic function of cubilin on visceral endoderm and kidney proximal tubules. Development. 2004, 131 (19): 4787-4795. 10.1242/dev.01341.
Bielinska M, Narita N, Wilson DB: Distinct roles for visceral endoderm during embryonic mouse development. Int J Dev Biol. 1999, 43 (3): 183-205.
Belaoussoff M, Farrington SM, Baron MH: Hematopoietic induction and respecification of A-P identity by visceral endoderm signaling in the mouse embryo. Development. 1998, 125 (24): 5009-5018.
Beddington RS, Robertson EJ: Axis development and early asymmetry in mammals. Cell. 1999, 96 (2): 195-209. 10.1016/S0092-8674(00)80560-7.
Rossant J: Lineage development and polar asymmetries in the peri-implantation mouse blastocyst. Semin Cell Dev Biol. 2004, 15 (5): 573-581. 10.1016/j.semcdb.2004.04.003.
Cross JC, Werb Z, Fisher SJ: Implantation and the placenta: key pieces of the development puzzle. Science. 1994, 266 (5190): 1508-1518. 10.1126/science.7985020.
Baron MH: Molecular regulation of embryonic hematopoiesis and vascular development: a novel pathway. J Hematother Stem Cell Res. 2001, 10 (5): 587-594. 10.1089/152581601753193797.
Palis J, McGrath KE, Kingsley PD: Initiation of hematopoiesis and vasculogenesis in murine yolk sac explants. Blood. 1995, 86 (1): 156-163.
Kozyraki R, Fyfe J, Verroust PJ, Jacobsen C, Dautry-Varsat A, Gburek J, Willnow TE, Christensen EI, Moestrup SK: Megalin-dependent cubilin-mediated endocytosis is a major pathway for the apical uptake of transferrin in polarized epithelia. Proc Natl Acad Sci U S A. 2001, 98 (22): 12491-12496. 10.1073/pnas.211291398.
Wang X, Bornslaeger EA, Haub O, Tomihara-Newberger C, Lonberg N, Dinulos MB, Disteche CM, Copeland N, Gilbert DJ, Jenkins NA, Lacy E: A candidate gene for the amnionless gastrulation stage mouse mutation encodes a TRAF-related protein. Dev Biol. 1996, 177 (1): 274-290. 10.1006/dbio.1996.0162.
Tomihara-Newberger C, Haub O, Lee HG, Soares V, Manova K, Lacy E: The amn gene product is required in extraembryonic tissues for the generation of middle primitive streak derivatives. Dev Biol. 1998, 204 (1): 34-54. 10.1006/dbio.1998.9034.
Kalantry S, Manning S, Haub O, Tomihara-Newberger C, Lee HG, Fangman J, Disteche CM, Manova K, Lacy E: The amnionless gene, essential for mouse gastrulation, encodes a visceral-endoderm-specific protein with an extracellular cysteine-rich domain. Nat Genet. 2001, 27 (4): 412-416. 10.1038/86912.
Yang DH, Smith ER, Roland IH, Sheng Z, He J, Martin WD, Hamilton TC, Lambeth JD, Xu XX: Disabled-2 is essential for endodermal cell positioning and structure formation during mouse embryogenesis. Dev Biol. 2002, 251 (1): 27-44. 10.1006/dbio.2002.0810.
Morris SM, Arden SD, Roberts RC, Kendrick-Jones J, Cooper JA, Luzio JP, Buss F: Myosin VI binds to and localises with Dab2, potentially linking receptor-mediated endocytosis and the actin cytoskeleton. Traffic. 2002, 3 (5): 331-341. 10.1034/j.1600-0854.2002.30503.x.
Morris SM, Cooper JA: Disabled-2 colocalizes with the LDLR in clathrin-coated pits and interacts with AP-2. Traffic. 2001, 2 (2): 111-123. 10.1034/j.1600-0854.2001.020206.x.
Oleinikov AV, Zhao J, Makker SP: Cytosolic adaptor protein Dab2 is an intracellular ligand of endocytic receptor gp600/megalin. Biochem J. 2000, 347 Pt 3: 613-621. 10.1042/0264-6021:3470613.
Nagai J, Christensen EI, Morris SM, Willnow TE, Cooper JA, Nielsen R: Mutually dependent localization of megalin and Dab2 in the renal proximal tubule. Am J Physiol Renal Physiol. 2005, 289 (3): F569-76. 10.1152/ajprenal.00292.2004.
Xu XX, Yang W, Jackowski S, Rock CO: Cloning of a novel phosphoprotein regulated by colony-stimulating factor 1 shares a domain with the Drosophila disabled gene product. J Biol Chem. 1995, 270 (23): 14184-14191. 10.1074/jbc.270.23.14184.
Mishra SK, Keyel PA, Hawryluk MJ, Agostinelli NR, Watkins SC, Traub LM: Disabled-2 exhibits the properties of a cargo-selective endocytic clathrin adaptor. Embo J. 2002, 21 (18): 4915-4926. 10.1093/emboj/cdf487.
Maurer ME, Cooper JA: Endocytosis of megalin by visceral endoderm cells requires the Dab2 adaptor protein. J Cell Sci. 2005, 118 (Pt 22): 5345-5355. 10.1242/jcs.02650.
Inoue A, Sato O, Homma K, Ikebe M: DOC-2/DAB2 is the binding partner of myosin VI. Biochem Biophys Res Commun. 2002, 292 (2): 300-307. 10.1006/bbrc.2002.6636.
Buss F, Arden SD, Lindsay M, Luzio JP, Kendrick-Jones J: Myosin VI isoform localized to clathrin-coated vesicles with a role in clathrin-mediated endocytosis. Embo J. 2001, 20 (14): 3676-3684. 10.1093/emboj/20.14.3676.
Dance AL, Miller M, Seragaki S, Aryal P, White B, Aschenbrenner L, Hasson T: Regulation of myosin-VI targeting to endocytic compartments. Traffic. 2004, 5 (10): 798-813. 10.1111/j.1600-0854.2004.00224.x.
Hasson T: Myosin VI: two distinct roles in endocytosis. J Cell Sci. 2003, 116 (Pt 17): 3453-3461. 10.1242/jcs.00669.
Orlando RA, Farquhar MG: Functional domains of the receptor-associated protein (RAP). Proc Natl Acad Sci U S A. 1994, 91 (8): 3161-3165. 10.1073/pnas.91.8.3161.
Bu G, Marzolo MP: Role of rap in the biogenesis of lipoprotein receptors. Trends Cardiovasc Med. 2000, 10 (4): 148-155. 10.1016/S1050-1738(00)00045-1.
Bu G: The roles of receptor-associated protein (RAP) as a molecular chaperone for members of the LDL receptor family. Int Rev Cytol. 2001, 209: 79-116.
Orlando RA, Exner M, Czekay RP, Yamazaki H, Saito A, Ullrich R, Kerjaschki D, Farquhar MG: Identification of the second cluster of ligand-binding repeats in megalin as a site for receptor-ligand interactions. Proc Natl Acad Sci U S A. 1997, 94 (6): 2368-2373. 10.1073/pnas.94.6.2368.
Lee D, Walsh JD, Mikhailenko I, Yu P, Migliorini M, Wu Y, Krueger S, Curtis JE, Harris B, Lockett S, Blacklow SC, Strickland DK, Wang YX: RAP uses a histidine switch to regulate its interaction with LRP in the ER and Golgi. Mol Cell. 2006, 22 (3): 423-430. 10.1016/j.molcel.2006.04.011.
Czekay RP, Orlando RA, Woodward L, Lundstrom M, Farquhar MG: Endocytic trafficking of megalin/RAP complexes: dissociation of the complexes in late endosomes. Mol Biol Cell. 1997, 8 (3): 517-532.
Willnow TE, Armstrong SA, Hammer RE, Herz J: Functional expression of low density lipoprotein receptor-related protein is controlled by receptor-associated protein in vivo. Proc Natl Acad Sci U S A. 1995, 92 (10): 4537-4541. 10.1073/pnas.92.10.4537.
Biemesderfer D, Nagy T, DeGray B, Aronson PS: Specific association of megalin and the Na+/H+ exchanger isoform NHE3 in the proximal tubule. J Biol Chem. 1999, 274 (25): 17518-17524. 10.1074/jbc.274.25.17518.
Gekle M, Serrano OK, Drumm K, Mildenberger S, Freudinger R, Gassner B, Jansen HW, Christensen EI: NHE3 serves as a molecular tool for cAMP-mediated regulation of receptor-mediated endocytosis. Am J Physiol Renal Physiol. 2002, 283 (3): F549-58.
Shaw GM, Lammer EJ, Zhu H, Baker MW, Neri E, Finnell RH: Maternal periconceptional vitamin use, genetic variation of infant reduced folate carrier (A80G), and risk of spina bifida. Am J Med Genet. 2002, 108 (1): 1-6. 10.1002/ajmg.10195.
De Marco P, Calevo MG, Moroni A, Arata L, Merello E, Cama A, Finnell RH, Andreussi L, Capra V: Polymorphisms in genes involved in folate metabolism as risk factors for NTDs. Eur J Pediatr Surg. 2001, 11 Suppl 1: S14-7. 10.1055/s-2001-19739.
Pei LJ, Li ZW, Zhang W, Ren AG, Zhu HP, Hao L, Zhu JH, Li Z: [Epidemiological study on reduced folate carrier gene(RFC1 A80G) polymorphism and other risk factors of neural tube defects]. Beijing Da Xue Xue Bao. 2005, 37 (4): 341-345.
Pei L, Zhu H, Zhu J, Ren A, Finnell RH, Li Z: Genetic variation of infant reduced folate carrier (A80G) and risk of orofacial defects and congenital heart defects in China. Annals of epidemiology. 2006, 16 (5): 352-356. 10.1016/j.annepidem.2005.02.014.
Shaw GM, Zhu H, Lammer EJ, Yang W, Finnell RH: Genetic variation of infant reduced folate carrier (A80G) and risk of orofacial and conotruncal heart defects. Am J Epidemiol. 2003, 158 (8): 747-752. 10.1093/aje/kwg189.
Ma DW, Finnell RH, Davidson LA, Callaway ES, Spiegelstein O, Piedrahita JA, Salbaum JM, Kappen C, Weeks BR, James J, Bozinov D, Lupton JR, Chapkin RS: Folate transport gene inactivation in mice increases sensitivity to colon carcinogenesis. Cancer Res. 2005, 65 (3): 887-897.
Irizarry RA, Gautier L, Cope L: An R package for analyses of Affymetrix oligonucleotide arrays. The Analysis of Gene Expression Data: Methods and Software. Edited by: Parmigiani G, Garrett ES, Irizarry RA, Zeger SL. 2002, New York, Springer
Irizarry RA, Gautier L, Bolstad BM, Miller C: Affy: Methods for Affymetrix Oligonucleotide Arrays. R package version 1.5.8. 2004
R Development Core Team: R: A language and environment for statistical computing. R Foundation for Statistical Computing,. 2004, Vienna, Austria
Wright GW, Simon R: A random variance model for detection of differential gene expression in small microarray experiments. Bioinformatics. 2003, 19: 2448-2455. 10.1093/bioinformatics/btg345.
Benjamini-Hochberg Y: Controlling the false discovery rate: a practical and powerful approach to multiple testing. Journal of the Royal Statistical Society Series B. 1995, 57: 289-300.
Pfaffl MW, Horgan GW, Dempfle L: Relative expression software tool (REST) for group-wise comparison and statistical analysis of relative expression results in real-time PCR. Nucleic Acids Res. 2002, 30 (9): e36-10.1093/nar/30.9.e36.
Vandesompele J, De Preter K, Pattyn F, Poppe B, Van Roy N, De Paepe A, Speleman F: Accurate normalization of real-time quantitative RT-PCR data by geometric averaging of multiple internal control genes. Genome Biol. 2002, 3 (7): RESEARCH0034-10.1186/gb-2002-3-7-research0034.
Acknowledgements
This work was supported by NHLBI grant #P01 HL66398, and CoBRE grant #P20 RR018788. The UNMC Microarray Core Facility receives partial support from NIH grant #P20 RR016469 from the INBRE Program of the National Center for Research Resources.
Author information
Authors and Affiliations
Corresponding author
Additional information
Authors' contributions
JGvW: experimental design, data interpretation, preparation of figures; writing of manuscript; JM: RNA isolation and preparation of embryo samples for microarray; organization of gene ontology groups (Fig. 1); Ingenuity Pathway analysis (Fig. 2); quantitative RT-PCR validation; LS: statistical analysis of microarray data (Table 1 and supplemental); MvW: statistical analysis of quantitative RT-PCR data (Fig. 4); JW: maintenance of RFC1 mouse colony; timed matings, folate treatments, embryo harvest, graphic design (Fig. 3), photography of immunostained sections (Fig. 5, Fig. 6); JDE: hybridization and scanning of Affymetrix microarray gene chips; LKB: histology, immunohistochemistry; RHF: provided RFC1 knockout mouse model; assisted with writing of manuscript. All authors read and approved the final manuscript.
Electronic supplementary material
12864_2007_1350_MOESM1_ESM.doc
Additional file 1: RFC1 microarray gene table. This table provides a complete list of the 200 known genes that were differentially expressed between E9.5 RFC1 nullizygous and wildtype embryos following statistical analysis of the microarray data, including RefSeq transcript ID, gene symbol, description, and fold change for each gene. (DOC 280 KB)
12864_2007_1350_MOESM2_ESM.doc
Additional file 2: Comparison of mouse mutants. This table compares the phenotype of RFC1 nullizygous embryos (on low or high dose maternal folate supplementation) with the phenotype of embryos in which different genes in the cubilin-megalin multiligand endocytic receptor complex (ie. cubilin, amnionless, megalin, Folr1, Dab2, Lrpap1) have been inactivated. (DOC 53 KB)
12864_2007_1350_MOESM3_ESM.doc
Additional file 3: Quantitative RT-PCR primer/probe list. This table contains a complete list and details regarding the primers/probes used in the qRT-PCR analysis of genes in the multiligand endocytic receptor complex, as well as details on the function of each gene examined. (DOC 46 KB)
Authors’ original submitted files for images
Below are the links to the authors’ original submitted files for images.
Rights and permissions
This article is published under license to BioMed Central Ltd. This is an Open Access article distributed under the terms of the Creative Commons Attribution License (http://creativecommons.org/licenses/by/2.0), which permits unrestricted use, distribution, and reproduction in any medium, provided the original work is properly cited.
About this article
Cite this article
Gelineau-van Waes, J., Maddox, J.R., Smith, L.M. et al. Microarray analysis of E9.5 reduced folate carrier (RFC1; Slc19a1) knockout embryos reveals altered expression of genes in the cubilin-megalin multiligand endocytic receptor complex. BMC Genomics 9, 156 (2008). https://doi.org/10.1186/1471-2164-9-156
Received:
Accepted:
Published:
DOI: https://doi.org/10.1186/1471-2164-9-156